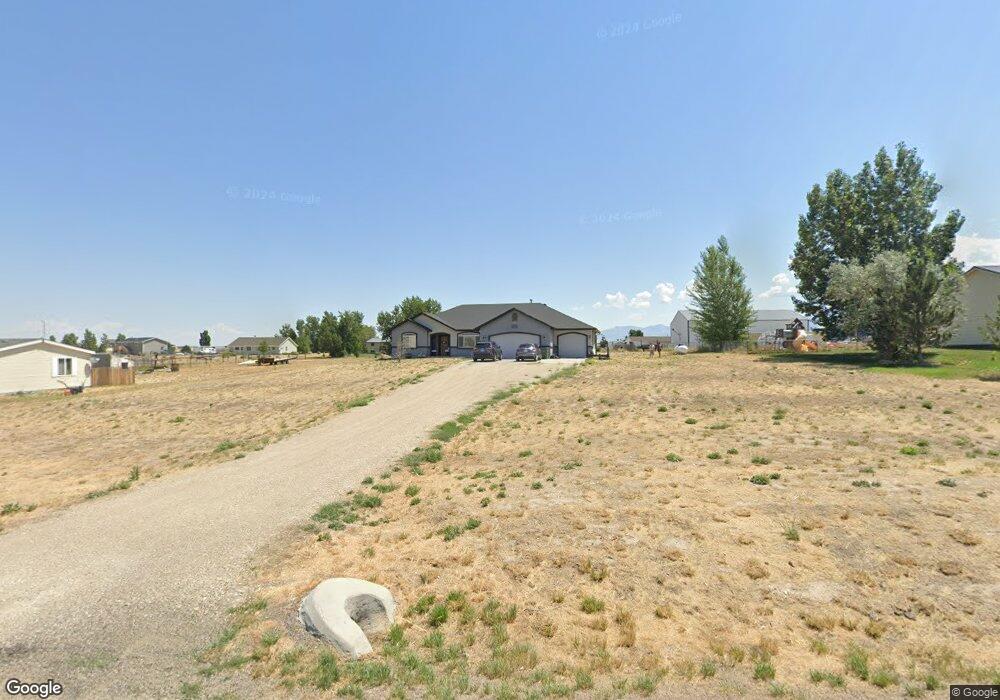
484 Rawlings Dr Spring Creek, NV 89815
Estimated Value: $384,000 - $428,498
3
Beds
2
Baths
1,879
Sq Ft
$221/Sq Ft
Est. Value
About This Home
This home is located at 484 Rawlings Dr, Spring Creek, NV 89815 and is currently estimated at $414,875, approximately $220 per square foot. 484 Rawlings Dr is a home located in Elko County with nearby schools including Spring Creek Elementary School, Spring Creek Middle School, and Spring Creek High School.
Ownership History
Date
Name
Owned For
Owner Type
Purchase Details
Closed on
Sep 13, 2024
Sold by
Garrard Roy D
Bought by
Garrard Roy D and Griffith-Coite Maria E
Current Estimated Value
Purchase Details
Closed on
Jun 25, 2012
Sold by
Arnold Beck Construction Inc
Bought by
Garrard Roy D
Home Financials for this Owner
Home Financials are based on the most recent Mortgage that was taken out on this home.
Original Mortgage
$193,520
Interest Rate
3.74%
Mortgage Type
New Conventional
Purchase Details
Closed on
Jan 31, 2012
Sold by
Peters Dennis L and Peters Iris A
Bought by
Arnold Beck Construction Inc
Purchase Details
Closed on
Sep 12, 2005
Sold by
Wappel Donald J and Wappel Marilyn S
Bought by
Peters Dennis L and Peters Iris A
Create a Home Valuation Report for This Property
The Home Valuation Report is an in-depth analysis detailing your home's value as well as a comparison with similar homes in the area
Home Values in the Area
Average Home Value in this Area
Purchase History
| Date | Buyer | Sale Price | Title Company |
|---|---|---|---|
| Garrard Roy D | -- | None Listed On Document | |
| Garrard Roy D | $242,000 | First American Title Elko | |
| Arnold Beck Construction Inc | $16,000 | First American Title Elko | |
| Peters Dennis L | $14,000 | Stewart Title |
Source: Public Records
Mortgage History
| Date | Status | Borrower | Loan Amount |
|---|---|---|---|
| Previous Owner | Garrard Roy D | $193,520 |
Source: Public Records
Tax History Compared to Growth
Tax History
| Year | Tax Paid | Tax Assessment Tax Assessment Total Assessment is a certain percentage of the fair market value that is determined by local assessors to be the total taxable value of land and additions on the property. | Land | Improvement |
|---|---|---|---|---|
| 2025 | $3,042 | $119,698 | $17,500 | $102,198 |
| 2024 | $3,042 | $120,954 | $17,500 | $103,454 |
| 2023 | $2,718 | $113,582 | $16,800 | $96,782 |
| 2022 | $2,639 | $98,500 | $16,800 | $81,700 |
| 2021 | $2,653 | $96,289 | $16,800 | $79,489 |
| 2020 | $2,591 | $97,178 | $16,800 | $80,378 |
| 2019 | $2,500 | $88,550 | $7,700 | $80,850 |
| 2018 | $2,498 | $88,765 | $7,700 | $81,065 |
| 2017 | $2,229 | $86,866 | $7,700 | $79,166 |
| 2016 | $2,111 | $80,602 | $7,700 | $72,902 |
| 2015 | $2,065 | $79,244 | $7,700 | $71,544 |
| 2014 | $1,938 | $75,497 | $7,700 | $67,797 |
Source: Public Records
Map
Nearby Homes
- 486 Shadybrook Dr
- 254 Springfield Pkwy
- 514 Shadybrook Dr
- 452 Rawlings Dr
- 522 Shadybrook Dr
- 526 Shadybrook Dr
- 444 Rawlings Dr
- 263 Springfield Pkwy
- 630 Shadybrook Dr
- 480 Shadypoint Dr
- 302 Springfield Pkwy
- 559 Diamondback Dr
- 422 Diamondback Dr
- 22 Gallinas Dr
- 4 Licht Pkwy
- 187 Flowing Wells Dr
- 728 Diamondback Dr
- 277 Glenvista Dr
- 470 Lawndale Dr
- 527 Lawndale Place
- 480 Rawlings Dr
- 488 Rawlings Dr
- 476 Rawlings Dr
- 487 Shadybrook Dr
- 492 Rawlings Dr
- 483 Shadybrook Dr
- 491 Shadybrook Dr
- 485 Rawlings Dr
- 479 Shadybrook Dr
- 475 Rawlings Dr
- 491 Rawlings Dr
- 472 Rawlings Dr
- 479 Rawlings Dr
- 495 Shadybrook Dr
- 475 Shadybrook Dr
- 498 Lilac Dr
- 499 Shadybrook Dr
- 490 Shadybrook Dr
- 500 Rawlings Dr
- 486 Lilac Dr