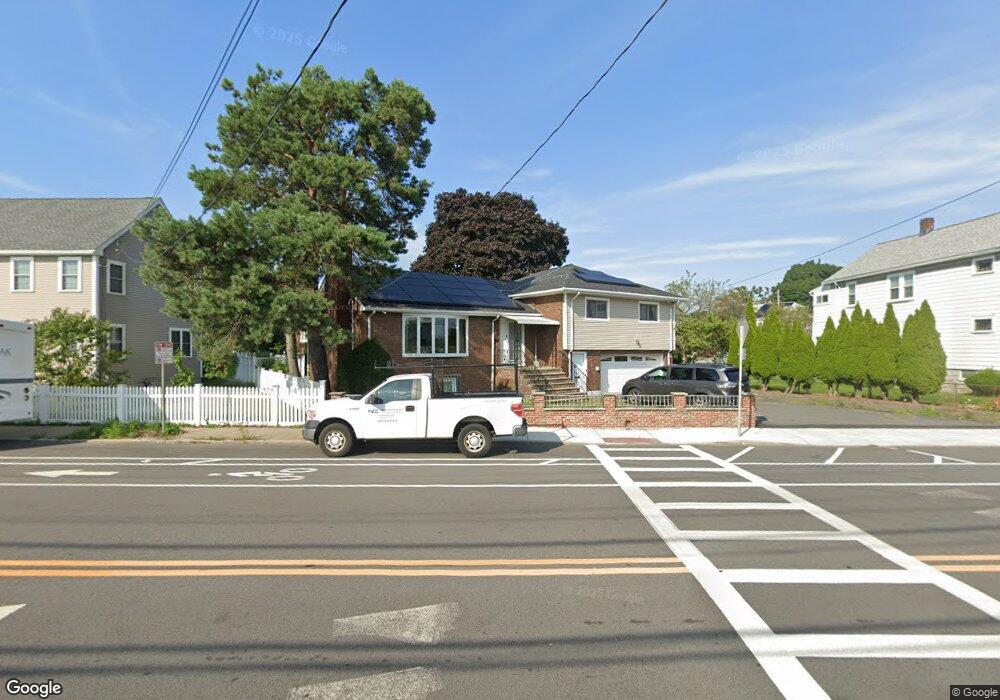
484 Riverside Ave Medford, MA 02155
Wellington NeighborhoodEstimated Value: $844,000 - $926,433
3
Beds
3
Baths
1,788
Sq Ft
$498/Sq Ft
Est. Value
About This Home
This home is located at 484 Riverside Ave, Medford, MA 02155 and is currently estimated at $890,858, approximately $498 per square foot. 484 Riverside Ave is a home located in Middlesex County with nearby schools including Medford High School, Mystic Valley Regional Charter School, and Bright Future Educare Center.
Ownership History
Date
Name
Owned For
Owner Type
Purchase Details
Closed on
Sep 20, 2022
Sold by
Liang Wei B
Bought by
Paradise Rt and Liang Wei Bank Tr
Current Estimated Value
Purchase Details
Closed on
Oct 14, 2009
Sold by
Deutsche Bank Natl T C
Bought by
Liang Wei Bang
Purchase Details
Closed on
Dec 22, 2008
Sold by
Green Debbie and Deutsche Bank Natl T C
Bought by
Deutsche Bank Natl T C
Purchase Details
Closed on
Oct 3, 2002
Sold by
Devitto Louise C
Bought by
Green Debbie
Home Financials for this Owner
Home Financials are based on the most recent Mortgage that was taken out on this home.
Original Mortgage
$396,000
Interest Rate
6.27%
Mortgage Type
Purchase Money Mortgage
Purchase Details
Closed on
Jun 26, 1990
Sold by
Kelley Helen R
Bought by
Devitto Louise C
Create a Home Valuation Report for This Property
The Home Valuation Report is an in-depth analysis detailing your home's value as well as a comparison with similar homes in the area
Home Values in the Area
Average Home Value in this Area
Purchase History
| Date | Buyer | Sale Price | Title Company |
|---|---|---|---|
| Paradise Rt | -- | None Available | |
| Liang Wei Bang | $340,000 | -- | |
| Deutsche Bank Natl T C | $435,332 | -- | |
| Green Debbie | $495,000 | -- | |
| Devitto Louise C | $75,000 | -- |
Source: Public Records
Mortgage History
| Date | Status | Borrower | Loan Amount |
|---|---|---|---|
| Previous Owner | Devitto Louise C | $100,000 | |
| Previous Owner | Green Debbie | $396,000 | |
| Previous Owner | Devitto Louise C | $74,250 |
Source: Public Records
Tax History Compared to Growth
Tax History
| Year | Tax Paid | Tax Assessment Tax Assessment Total Assessment is a certain percentage of the fair market value that is determined by local assessors to be the total taxable value of land and additions on the property. | Land | Improvement |
|---|---|---|---|---|
| 2025 | $7,538 | $856,600 | $392,300 | $464,300 |
| 2024 | $6,913 | $811,400 | $373,600 | $437,800 |
| 2023 | $6,731 | $778,200 | $349,200 | $429,000 |
| 2022 | $5,990 | $664,800 | $317,500 | $347,300 |
| 2021 | $6,113 | $649,600 | $302,300 | $347,300 |
| 2020 | $5,903 | $643,000 | $302,300 | $340,700 |
| 2019 | $5,867 | $611,100 | $274,800 | $336,300 |
| 2018 | $5,323 | $519,800 | $249,800 | $270,000 |
| 2017 | $5,345 | $506,200 | $233,500 | $272,700 |
| 2016 | $5,220 | $466,500 | $212,300 | $254,200 |
| 2015 | $5,203 | $444,700 | $202,100 | $242,600 |
Source: Public Records
Map
Nearby Homes
- 830 Fellsway
- 82 2nd St
- 320 Middlesex Ave Unit A207
- 320 Middlesex Ave Unit E403
- 320 Middlesex Ave Unit A406
- 320 Middlesex Ave Unit A208
- 57 1st St Unit 2
- 42 Gibson St
- 55 Evans St
- 8 Ninth St Unit 303
- 8 9th St Unit 406
- 8 9th St Unit 513
- 3920 Mystic Valley Pkwy Unit 217W
- 3920 Mystic Valley Pkwy Unit 1119W
- 3920 Mystic Valley Pkwy Unit 620
- 3920 Mystic Valley Pkwy Unit 817
- 3920 Mystic Valley Pkwy Unit 303
- 3920 Mystic Valley Pkwy Unit 115
- 74 Highland Ave
- 305 Riverside Ave Unit 41
- 490 Riverside Ave
- 492 Riverside Ave
- 492 Riverside Ave Unit 2
- 492 Riverside Ave Unit 1
- 476 Riverside Ave
- 158 4th St
- 154 4th St
- 150152 4th St
- 150 4th St
- 152 4th St Unit 152
- 164 4th St
- 148 4th St
- 74 Saint James Rd
- 70 Saint James Rd
- 477 Riverside Ave
- 157 4th St
- 66 Saint James Rd
- 144 4th St
- 161 4th St
- 161 4th St Unit 161