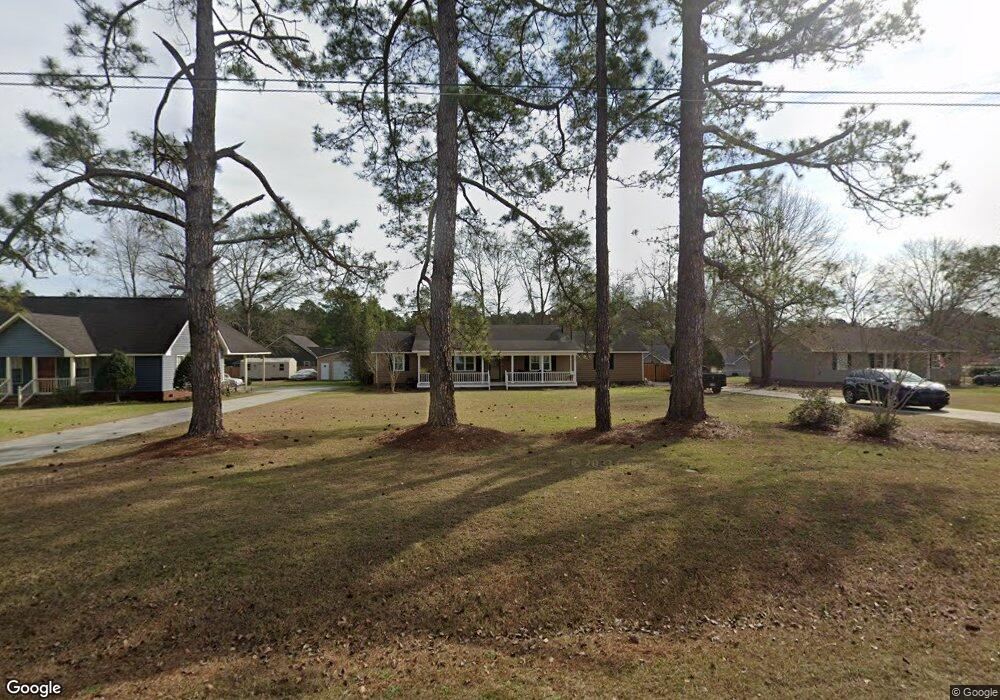
484 Tallokas Trail Moultrie, GA 31788
Estimated Value: $203,175 - $318,000
--
Bed
2
Baths
1,302
Sq Ft
$193/Sq Ft
Est. Value
About This Home
This home is located at 484 Tallokas Trail, Moultrie, GA 31788 and is currently estimated at $250,794, approximately $192 per square foot. 484 Tallokas Trail is a home located in Colquitt County with nearby schools including Sunset Elementary School, Willie J. Williams Middle School, and C.A. Gray Junior High School.
Ownership History
Date
Name
Owned For
Owner Type
Purchase Details
Closed on
May 27, 2022
Sold by
Drewmarc Corp
Bought by
Pritchett Thomas L and Pritchett Shirley B
Current Estimated Value
Purchase Details
Closed on
Feb 7, 2020
Sold by
Christopher Kenneth H
Bought by
Corporation Drewmarc
Purchase Details
Closed on
Jan 27, 2015
Sold by
Christopher William O
Bought by
Christopher Kenneth H and Christopher Leah P
Purchase Details
Closed on
May 1, 2008
Sold by
Griffin Russell G
Bought by
Christopher Williamc O
Home Financials for this Owner
Home Financials are based on the most recent Mortgage that was taken out on this home.
Original Mortgage
$137,738
Interest Rate
5.86%
Mortgage Type
New Conventional
Purchase Details
Closed on
Mar 19, 1997
Bought by
Griffin Russell G
Purchase Details
Closed on
Jul 30, 1996
Bought by
King William J
Purchase Details
Closed on
Dec 22, 1993
Bought by
Kaplan Kenneth S
Create a Home Valuation Report for This Property
The Home Valuation Report is an in-depth analysis detailing your home's value as well as a comparison with similar homes in the area
Home Values in the Area
Average Home Value in this Area
Purchase History
| Date | Buyer | Sale Price | Title Company |
|---|---|---|---|
| Pritchett Thomas L | $185,000 | -- | |
| Corporation Drewmarc | $135,000 | -- | |
| Christopher Kenneth H | -- | -- | |
| Christopher Williamc O | $139,900 | -- | |
| Griffin Russell G | $67,000 | -- | |
| King William J | $59,000 | -- | |
| Kaplan Kenneth S | $52,000 | -- |
Source: Public Records
Mortgage History
| Date | Status | Borrower | Loan Amount |
|---|---|---|---|
| Previous Owner | Christopher Williamc O | $137,738 |
Source: Public Records
Tax History Compared to Growth
Tax History
| Year | Tax Paid | Tax Assessment Tax Assessment Total Assessment is a certain percentage of the fair market value that is determined by local assessors to be the total taxable value of land and additions on the property. | Land | Improvement |
|---|---|---|---|---|
| 2024 | $1,140 | $63,178 | $6,240 | $56,938 |
| 2023 | $1,199 | $60,318 | $6,240 | $54,078 |
| 2022 | $1,344 | $56,451 | $6,240 | $50,211 |
| 2021 | $1,310 | $53,962 | $6,240 | $47,722 |
| 2020 | $1,197 | $48,430 | $6,240 | $42,190 |
| 2019 | $1,135 | $41,272 | $6,240 | $35,032 |
| 2018 | $1,056 | $41,272 | $6,240 | $35,032 |
| 2017 | $1,390 | $51,058 | $8,000 | $43,058 |
| 2016 | $1,408 | $51,058 | $8,000 | $43,058 |
| 2015 | $1,421 | $51,058 | $8,000 | $43,058 |
| 2014 | $1,261 | $46,155 | $8,000 | $38,155 |
| 2013 | -- | $46,154 | $8,000 | $38,154 |
Source: Public Records
Map
Nearby Homes
- 270 Old Timey Trail
- 132 Tallokas Trail
- 410 Indian Trail
- 0 Old Timey Trail
- 104 Inner Cir
- 149 Tallokas Cir
- 125 Inner Cir
- 31 31st Ave SE
- 424 U S Highway 319
- 4 Baldwin Place SE
- 128 Flint Dr
- 124 Flint Dr
- 35 Cobblestone Blvd SE
- 0 26th Ave SE
- 7 SE Pheasant Ln
- 85 Cobblestone Blvd SE
- 16 Francine Way SE
- 72 Packer Pride Dr SE
- 69 Packer Pride Dr SE
- 65 Packer Pride Dr SE
- 474 Tallokas Trail
- 494 Tallokas Trail
- 000 Tallokas Trail
- 159 Friendship Trail
- 184 Friendship Trail
- 464 Tallokas Trail
- 504 Tallokas Trail
- 149 Friendship Trail
- 165 Friendship Trail
- 481 Tallokas Trail
- 489 Tallokas Trail
- 177 Friendship Trail
- 454 Tallokas Trail
- 501 Tallokas Trail
- 514 Tallokas Trail
- 141 Friendship Trail
- 457 Pioneer Trail
- 511 Tallokas Trail
- 183 Friendship Trail
- 455 Pioneer Trail