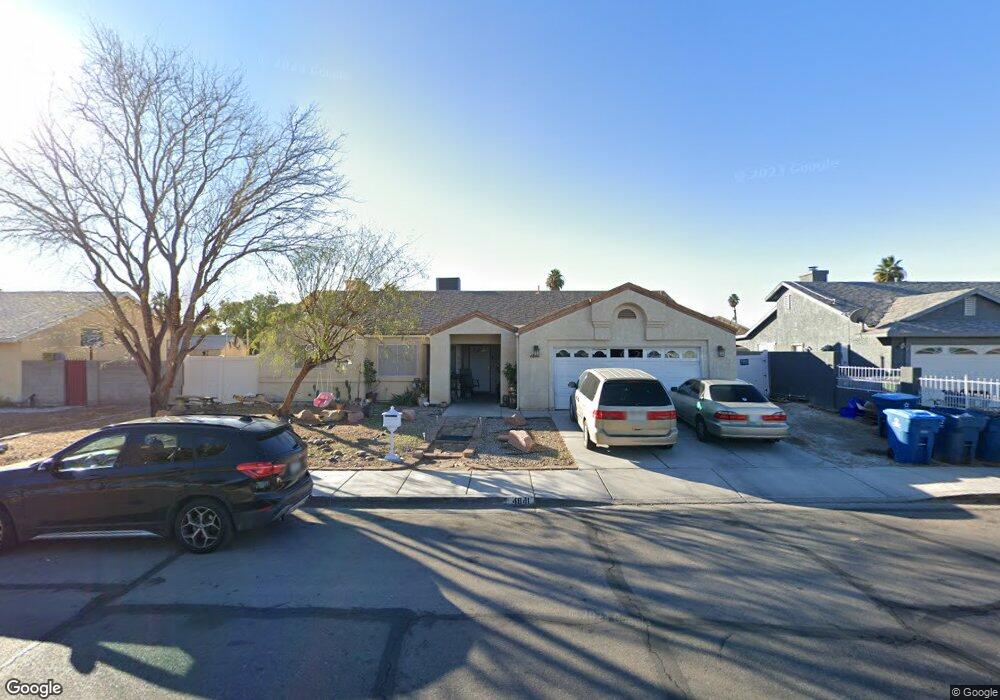
4841 E Colorado Ave Las Vegas, NV 89104
Estimated Value: $374,477 - $461,000
4
Beds
2
Baths
1,748
Sq Ft
$232/Sq Ft
Est. Value
About This Home
This home is located at 4841 E Colorado Ave, Las Vegas, NV 89104 and is currently estimated at $406,119, approximately $232 per square foot. 4841 E Colorado Ave is a home located in Clark County with nearby schools including William E. Snyder Elementary School, Jerome Mack Middle School, and Las Vegas High School.
Ownership History
Date
Name
Owned For
Owner Type
Purchase Details
Closed on
Feb 3, 2003
Sold by
Rempe Randy W and Rempe Janette S
Bought by
Amaya Luis A and Amaya Fausta
Current Estimated Value
Home Financials for this Owner
Home Financials are based on the most recent Mortgage that was taken out on this home.
Original Mortgage
$157,528
Outstanding Balance
$67,367
Interest Rate
5.93%
Mortgage Type
FHA
Estimated Equity
$338,752
Purchase Details
Closed on
Mar 10, 2001
Sold by
Rempe Randy W and Rempe Jannette S
Bought by
Randy W & Janette S Rempe Joint Living T
Home Financials for this Owner
Home Financials are based on the most recent Mortgage that was taken out on this home.
Original Mortgage
$100,000
Interest Rate
7.11%
Mortgage Type
Credit Line Revolving
Purchase Details
Closed on
Sep 16, 2000
Sold by
Rempe Randy W and Stewart Janette
Bought by
Randy W & Janette S Rempe Joint Living T
Create a Home Valuation Report for This Property
The Home Valuation Report is an in-depth analysis detailing your home's value as well as a comparison with similar homes in the area
Home Values in the Area
Average Home Value in this Area
Purchase History
| Date | Buyer | Sale Price | Title Company |
|---|---|---|---|
| Amaya Luis A | $160,000 | Old Republic Title Company | |
| Randy W & Janette S Rempe Joint Living T | -- | Lawyers Title | |
| Rempe Randy W | -- | Lawyers Title | |
| Randy W & Janette S Rempe Joint Living T | -- | -- |
Source: Public Records
Mortgage History
| Date | Status | Borrower | Loan Amount |
|---|---|---|---|
| Open | Amaya Luis A | $157,528 | |
| Previous Owner | Rempe Randy W | $100,000 |
Source: Public Records
Tax History Compared to Growth
Tax History
| Year | Tax Paid | Tax Assessment Tax Assessment Total Assessment is a certain percentage of the fair market value that is determined by local assessors to be the total taxable value of land and additions on the property. | Land | Improvement |
|---|---|---|---|---|
| 2025 | $1,388 | $84,202 | $26,250 | $57,952 |
| 2024 | $1,348 | $84,202 | $26,250 | $57,952 |
| 2023 | $1,348 | $85,127 | $29,750 | $55,377 |
| 2022 | $1,378 | $75,335 | $24,500 | $50,835 |
| 2021 | $1,271 | $69,560 | $21,000 | $48,560 |
| 2020 | $1,177 | $68,956 | $20,650 | $48,306 |
| 2019 | $1,103 | $67,015 | $19,250 | $47,765 |
| 2018 | $1,053 | $58,409 | $12,250 | $46,159 |
| 2017 | $1,736 | $59,208 | $12,250 | $46,958 |
| 2016 | $986 | $57,007 | $9,450 | $47,557 |
| 2015 | $984 | $44,405 | $7,700 | $36,705 |
| 2014 | $955 | $34,149 | $7,000 | $27,149 |
Source: Public Records
Map
Nearby Homes
- 4746 Yuma Ave
- 4939 Yuma Ave
- 1405 S Nellis Blvd Unit 1121
- 1405 S Nellis Blvd Unit 1008
- 1405 S Nellis Blvd Unit 2082
- 1405 S Nellis Blvd Unit 2117
- 1405 S Nellis Blvd Unit 2087
- 1300 S Arlington St Unit 113
- 1300 S Arlington St Unit 126
- 1300 S Arlington St Unit 120
- 1485 Arden St
- 4820 Mahogany Dr
- 4906 E Chicago Ave
- 4709 Mahogany Dr
- 1761 Arden St
- 4928 E Philadelphia Ave
- 11 Page St
- 5115 Blossom Ave
- 4496 Skyview Dr
- 4458 Skyview Dr
- 4831 E Colorado Ave
- 4861 E Colorado Ave
- 4840 Yuma Ave
- 4834 Yuma Ave
- 4821 E Colorado Ave
- 4846 E Colorado Ave
- 4871 E Colorado Ave
- 4830 E Colorado Ave
- 4860 E Colorado Ave
- 4864 Yuma Ave
- 4820 Yuma Ave
- 4820 E Colorado Ave
- 4811 E Colorado Ave
- 4870 E Colorado Ave
- 4874 Yuma Ave
- 4810 Yuma Ave
- 4841 Yuma Ave
- 4837 Arizona Ave
- 4851 Arizona Ave
- 4853 Yuma Ave