Estimated Value: $246,000 - $290,000
3
Beds
2
Baths
1,356
Sq Ft
$199/Sq Ft
Est. Value
About This Home
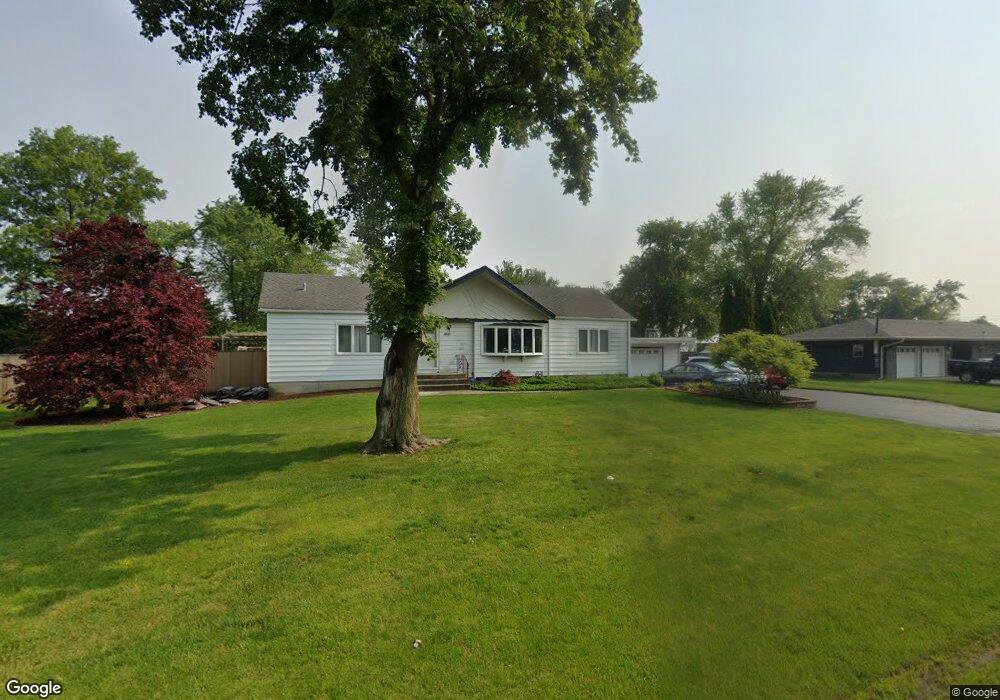
This home is located at 4842 W Main St, Monee, IL 60449 and is currently estimated at $270,337, approximately $199 per square foot. 4842 W Main St is a home located in Will County with nearby schools including Monee Elementary School, Crete-Monee Middle School, and Crete-Monee High School.
Ownership History
Date
Name
Owned For
Owner Type
Purchase Details
Closed on
Jun 4, 2013
Sold by
Schroeder Ward Kristin
Bought by
Ward Patrick
Current Estimated Value
Purchase Details
Closed on
Aug 28, 2000
Sold by
Aprile Frank J and Emily T Aprile Trust
Bought by
Ward Patrick W and Ward Kristin S
Home Financials for this Owner
Home Financials are based on the most recent Mortgage that was taken out on this home.
Original Mortgage
$119,400
Outstanding Balance
$42,807
Interest Rate
7.87%
Estimated Equity
$227,530
Purchase Details
Closed on
Feb 10, 1997
Sold by
Aprile Emily
Bought by
Aprile Emily T and Emily T Aprile Trust
Create a Home Valuation Report for This Property
The Home Valuation Report is an in-depth analysis detailing your home's value as well as a comparison with similar homes in the area
Home Values in the Area
Average Home Value in this Area
Purchase History
| Date | Buyer | Sale Price | Title Company |
|---|---|---|---|
| Ward Patrick | -- | First American Title Insuran | |
| Ward Patrick W | $133,000 | Chicago Title Insurance Co | |
| Aprile Emily T | -- | -- |
Source: Public Records
Mortgage History
| Date | Status | Borrower | Loan Amount |
|---|---|---|---|
| Open | Ward Patrick W | $119,400 |
Source: Public Records
Tax History
| Year | Tax Paid | Tax Assessment Tax Assessment Total Assessment is a certain percentage of the fair market value that is determined by local assessors to be the total taxable value of land and additions on the property. | Land | Improvement |
|---|---|---|---|---|
| 2024 | $7,286 | $77,862 | $20,002 | $57,860 |
| 2023 | $7,286 | $67,122 | $17,243 | $49,879 |
| 2022 | $6,806 | $58,185 | $15,168 | $43,017 |
| 2021 | $5,841 | $53,049 | $13,932 | $39,117 |
| 2020 | $5,854 | $51,329 | $13,480 | $37,849 |
| 2019 | $5,627 | $48,676 | $12,783 | $35,893 |
| 2018 | $5,474 | $46,908 | $12,521 | $34,387 |
| 2017 | $5,556 | $46,555 | $12,145 | $34,410 |
| 2016 | $5,513 | $45,504 | $11,688 | $33,816 |
| 2015 | $4,787 | $41,593 | $10,701 | $30,892 |
| 2014 | $4,787 | $41,018 | $10,553 | $30,465 |
| 2013 | $4,787 | $42,950 | $11,050 | $31,900 |
Source: Public Records
Map
Nearby Homes
- 26048 S Countyfair Dr
- 25749 Shoal Creek Dr Unit 209
- 25751 Scioto Dr Unit 34
- 25753 Shoal Creek Dr Unit 208
- 4825 Colonial Dr Unit 219
- 4923 Colonial Dr Unit 180
- 5110 Fairground Ct
- 25807 S Doral Dr
- 5016 W Colonial Dr Unit 317
- 4942 W Ribbon Ct
- 5103 W Park Ln
- 25603 S Medinah Dr Unit 330
- 25604 S Medinah Dr Unit 391
- 25727 S Mccorkle Ave
- 5038 W Sawgrass Dr Unit 386
- 5042 W Sawgrass Dr Unit 387
- 5046 W Sawgrass Dr Unit 388
- 5221 W Mulberry Ln
- 25530 Shinnecock Dr
- 25836 S Linden Ave
- 4828 W Main St
- 4900 W Main St
- 4851 W Court St
- 4855 W Main St
- 4829 W Court St
- 4905 W Court St
- 4845 W Main St
- 4825 W Main St
- 4905 W Main St
- 4827 W Main St
- 4913 W Court St
- 4806 W Main St
- 4817 W Main St
- 4805 W Court St
- 4805 W Court St
- 4922 W Main St
- 4913 W Main St
- 4807 W Main St
- 4854 W Court St
- 4840 W Court St
Your Personal Tour Guide
Ask me questions while you tour the home.