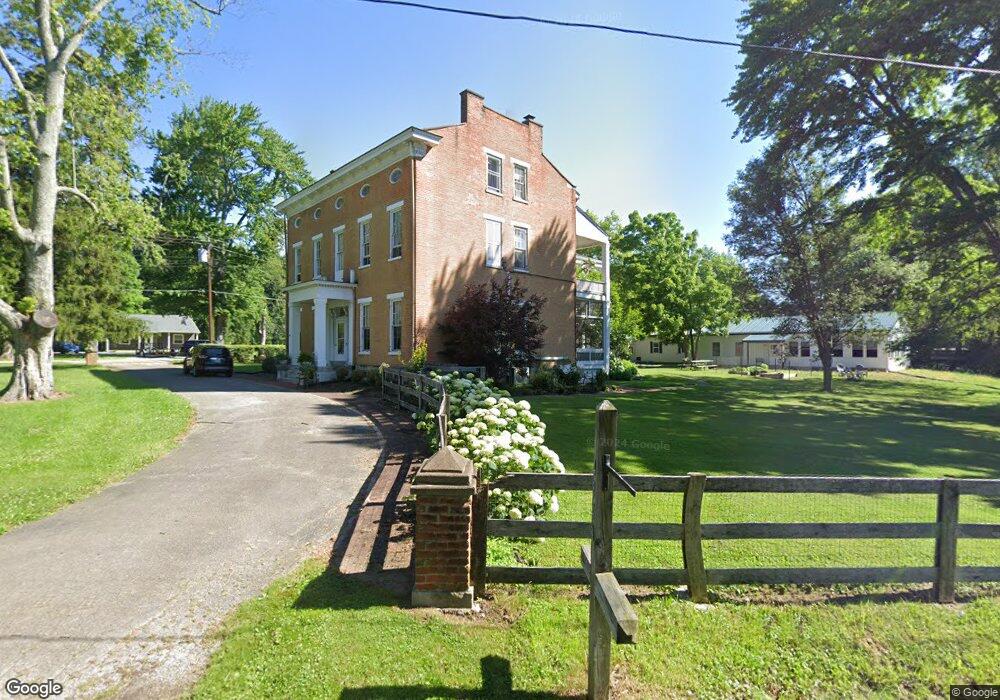
4843 Brown County Inn Rd Lynchburg, OH 45142
Estimated Value: $158,588 - $507,000
8
Beds
3
Baths
4,080
Sq Ft
$95/Sq Ft
Est. Value
About This Home
This home is located at 4843 Brown County Inn Rd, Lynchburg, OH 45142 and is currently estimated at $388,647, approximately $95 per square foot. 4843 Brown County Inn Rd is a home located in Brown County with nearby schools including Fayetteville-Perry Elementary School, Fayetteville-Perry Middle School, and Fayetteville-Perry High School.
Ownership History
Date
Name
Owned For
Owner Type
Purchase Details
Closed on
Jul 10, 2013
Sold by
Gendreau Jean J and Burdette Emilie
Bought by
Lynch Julie W and Lynch James
Current Estimated Value
Home Financials for this Owner
Home Financials are based on the most recent Mortgage that was taken out on this home.
Original Mortgage
$17,550
Interest Rate
3.83%
Mortgage Type
Future Advance Clause Open End Mortgage
Purchase Details
Closed on
May 6, 2009
Sold by
Gendreau Jean J and Gendreau Jean
Bought by
Lynch James and Lynch Julie W
Home Financials for this Owner
Home Financials are based on the most recent Mortgage that was taken out on this home.
Original Mortgage
$155,700
Interest Rate
4.9%
Mortgage Type
Unknown
Create a Home Valuation Report for This Property
The Home Valuation Report is an in-depth analysis detailing your home's value as well as a comparison with similar homes in the area
Home Values in the Area
Average Home Value in this Area
Purchase History
| Date | Buyer | Sale Price | Title Company |
|---|---|---|---|
| Lynch Julie W | $27,000 | None Available | |
| Lynch James | $173,000 | Attorney |
Source: Public Records
Mortgage History
| Date | Status | Borrower | Loan Amount |
|---|---|---|---|
| Previous Owner | Lynch Julie W | $17,550 | |
| Previous Owner | Lynch James | $155,700 |
Source: Public Records
Tax History Compared to Growth
Tax History
| Year | Tax Paid | Tax Assessment Tax Assessment Total Assessment is a certain percentage of the fair market value that is determined by local assessors to be the total taxable value of land and additions on the property. | Land | Improvement |
|---|---|---|---|---|
| 2024 | $3,113 | $79,430 | $10,250 | $69,180 |
| 2023 | $2,701 | $62,700 | $8,020 | $54,680 |
| 2022 | $2,395 | $54,150 | $8,020 | $46,130 |
| 2021 | $2,376 | $54,150 | $8,020 | $46,130 |
| 2020 | $2,185 | $47,080 | $6,970 | $40,110 |
| 2019 | $1,148 | $47,080 | $6,970 | $40,110 |
| 2018 | $1,749 | $47,080 | $6,970 | $40,110 |
| 2017 | $1,765 | $46,100 | $6,510 | $39,590 |
| 2016 | $1,798 | $46,100 | $6,510 | $39,590 |
| 2015 | $1,843 | $46,100 | $6,510 | $39,590 |
| 2014 | $1,843 | $45,510 | $5,920 | $39,590 |
| 2013 | $1,847 | $45,510 | $5,920 | $39,590 |
Source: Public Records
Map
Nearby Homes
- 4824 Anderson State Rd
- 4997 Kernan Rd
- 4864 Murray Corner Rd
- 117 E Pike St
- 411 Bank St
- 2710 Glady Rd
- 21411 Fayetteville Rd
- 14456 U S 68
- 3836 Highway 50
- 1811 Crampton Rd
- 20623 Fayetteville Blanchester Rd
- 1203 Harz Cove
- 1398 Lorelei Dr
- 5874 St Rt 134
- 1343 Oder Dr
- 19910 Vera Cruz Rd
- 1027 Lorelei Dr
- 19022 U S 68
- 980 Krupp Dr
- 843 Krupp Dr
- 4873 Brown County Inn Rd
- 4832 Anderson State Rd
- 4833 Anderson State Rd
- 4849 Anderson State Rd
- 4821 Anderson State Rd
- 220 Church St
- 4863 Anderson State Rd
- 4863 Anderson State Rd
- 4863 Anderson State Rd
- 4797 Church St
- 4797 Church St
- 4769 Anderson State Rd
- 4819 Church St
- 1.84ac Church St
- 4745 Church St
- 4739 Church St
- 4726 Church St
- 20936 State Route 251
- 20988 St Rt 251
- 21014 State Route 251