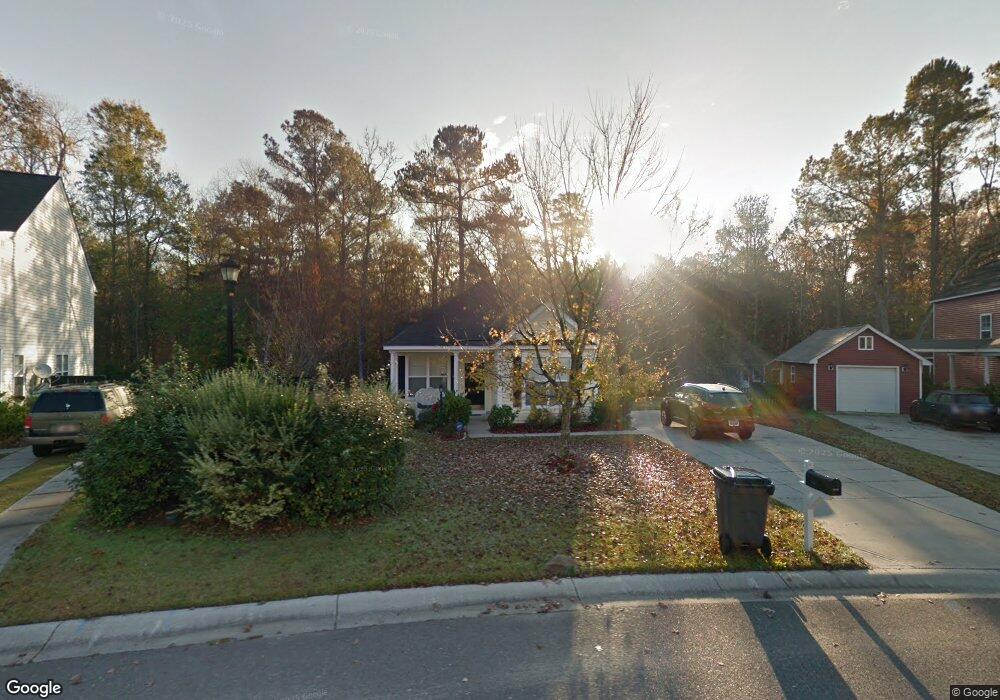
4844 Buttercup Way Summerville, SC 29485
Estimated Value: $290,000 - $335,000
3
Beds
2
Baths
1,209
Sq Ft
$252/Sq Ft
Est. Value
About This Home
This home is located at 4844 Buttercup Way, Summerville, SC 29485 and is currently estimated at $304,628, approximately $251 per square foot. 4844 Buttercup Way is a home with nearby schools including Joseph R. Pye Elementary, River Oaks Middle School, and Fort Dorchester High School.
Ownership History
Date
Name
Owned For
Owner Type
Purchase Details
Closed on
Oct 12, 2023
Sold by
Sherman Yvonne C and Dederick Michael K
Bought by
Kilgore John D and Kilgore Colleen
Current Estimated Value
Home Financials for this Owner
Home Financials are based on the most recent Mortgage that was taken out on this home.
Original Mortgage
$240,750
Outstanding Balance
$233,958
Interest Rate
4%
Mortgage Type
VA
Estimated Equity
$70,670
Purchase Details
Closed on
Nov 26, 2018
Sold by
Sherman Yvonne C
Bought by
Sherman Yvonne C and Dederick Michael K
Purchase Details
Closed on
Sep 2, 2016
Sold by
Dederick Michael K
Bought by
Sherman Yvonne C
Purchase Details
Closed on
Jul 7, 2014
Sold by
Sherman Yvonne C
Bought by
Dederick Michael K
Purchase Details
Closed on
Mar 23, 2006
Sold by
D R Horton Inc
Bought by
Sherman Yvonne C
Create a Home Valuation Report for This Property
The Home Valuation Report is an in-depth analysis detailing your home's value as well as a comparison with similar homes in the area
Home Values in the Area
Average Home Value in this Area
Purchase History
| Date | Buyer | Sale Price | Title Company |
|---|---|---|---|
| Kilgore John D | $240,750 | South Carolina Title | |
| Kilgore John D | $240,750 | South Carolina Title | |
| Sherman Yvonne C | -- | None Available | |
| Sherman Yvonne C | -- | None Available | |
| Dederick Michael K | -- | -- | |
| Sherman Yvonne C | $160,000 | None Available |
Source: Public Records
Mortgage History
| Date | Status | Borrower | Loan Amount |
|---|---|---|---|
| Open | Kilgore John D | $240,750 | |
| Previous Owner | Sherman Yvonne C | $75,000 | |
| Previous Owner | Shermna Yvonne | $47,000 |
Source: Public Records
Tax History Compared to Growth
Tax History
| Year | Tax Paid | Tax Assessment Tax Assessment Total Assessment is a certain percentage of the fair market value that is determined by local assessors to be the total taxable value of land and additions on the property. | Land | Improvement |
|---|---|---|---|---|
| 2024 | $2,687 | $15,849 | $5,700 | $10,149 |
| 2023 | $2,687 | $7,170 | $2,000 | $5,170 |
| 2022 | $1,745 | $7,170 | $2,000 | $5,170 |
| 2021 | $1,650 | $7,170 | $2,000 | $5,170 |
| 2020 | $1,583 | $7,170 | $2,000 | $5,170 |
| 2019 | $1,562 | $7,170 | $2,000 | $5,170 |
| 2018 | $1,142 | $5,240 | $2,000 | $3,240 |
| 2017 | $1,093 | $5,240 | $2,000 | $3,240 |
| 2016 | $1,308 | $5,240 | $2,000 | $3,240 |
| 2015 | $1,305 | $5,240 | $2,000 | $3,240 |
| 2014 | $893 | $137,500 | $0 | $0 |
| 2013 | -- | $5,500 | $0 | $0 |
Source: Public Records
Map
Nearby Homes
- 4846 Buttercup Way
- 2000 Buttercup Way
- 1000 Buttercup Way
- 8955 Planters Row Ln
- 8953 Planters Row Ln
- 9049 Pickett Fence Ln
- 8942 N Red Maple Cir
- 9032 Pickett Fence Ln
- 8926 Cat Tail Pond Rd
- 4816 W Red Maple Cir
- 9126 Maple Grove Dr
- 8897 Cat Tail Pond Rd
- 9122 Maple Grove Dr
- 9176 Maple Grove Dr
- 8921 Skipping Rock Ln
- 9033 Robins Nest Way
- 4840 Oak Leaf Rd
- 8849 Kellum Dr
- 4824 Willow Brook Ln
- 4964 Hay Bale Ct
- 4842 Buttercup Way
- 4840 Buttercup Way
- 4848 Buttercup Way
- 4847 Buttercup Way
- 4838 Buttercup Way
- 4849 Buttercup Way
- 4836 Buttercup Way
- 4823 Holly Berry Ln
- 4850 Buttercup Way
- 4821 Holly Berry Ln
- 4834 Buttercup Way
- 4851 Buttercup Way
- 4852 Buttercup Way
- 4819 Holly Berry Ln
- 4853 Buttercup Way
- 4854 Buttercup Way
- 4832 Buttercup Way
- 4817 Holly Berry Ln
- 4822 Holly Berry Ln
- 4856 Buttercup Way