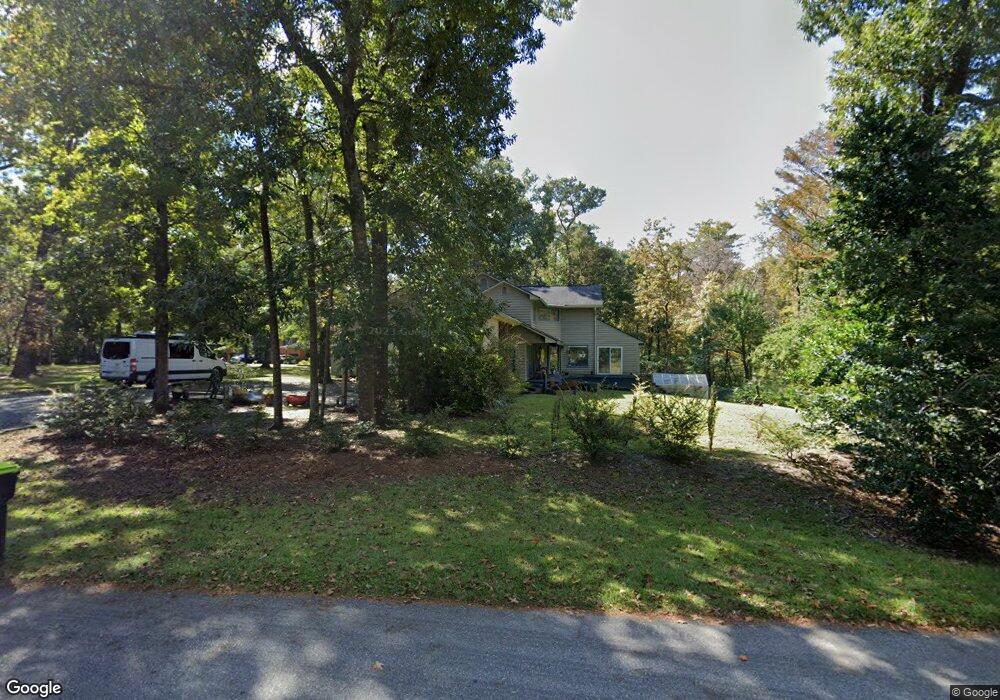
4844 Indian Corn Trail Castle Hayne, NC 28429
Estimated Value: $563,000 - $633,000
3
Beds
3
Baths
2,643
Sq Ft
$226/Sq Ft
Est. Value
About This Home
This home is located at 4844 Indian Corn Trail, Castle Hayne, NC 28429 and is currently estimated at $597,188, approximately $225 per square foot. 4844 Indian Corn Trail is a home located in New Hanover County with nearby schools including Castle Hayne Elementary School, Holly Shelter Middle School, and Emsley A. Laney High School.
Ownership History
Date
Name
Owned For
Owner Type
Purchase Details
Closed on
Nov 2, 2023
Sold by
Levine Stephen P
Bought by
Stephen P Levine Revocable Living Trust and Levine
Current Estimated Value
Purchase Details
Closed on
Jun 28, 2004
Sold by
Levine Stephen Paul Deborah C
Bought by
Levine Stephen P
Purchase Details
Closed on
Jan 18, 1996
Sold by
Levine Stephen Paul Deborah C
Bought by
Nc Dept Of Transportation
Purchase Details
Closed on
May 10, 1990
Sold by
Turner Mark K Glenda B
Bought by
Levine Stephen Paul Deborah C
Purchase Details
Closed on
Mar 1, 1988
Sold by
Mark Turner Builders Inc
Bought by
Turner Mark K Glenda B
Purchase Details
Closed on
Sep 1, 1986
Sold by
Simon Jr Albert S
Bought by
Mark Turner Builders Inc
Purchase Details
Closed on
Dec 13, 1983
Sold by
Simon Patricia R
Bought by
Simon Albert S
Purchase Details
Closed on
Aug 7, 1978
Sold by
Trask Raiford G Mabel Dunn
Bought by
Simon Albert S Jr Patricia R
Create a Home Valuation Report for This Property
The Home Valuation Report is an in-depth analysis detailing your home's value as well as a comparison with similar homes in the area
Home Values in the Area
Average Home Value in this Area
Purchase History
| Date | Buyer | Sale Price | Title Company |
|---|---|---|---|
| Stephen P Levine Revocable Living Trust | -- | None Listed On Document | |
| Levine Stephen P | -- | -- | |
| Nc Dept Of Transportation | -- | -- | |
| Levine Stephen Paul Deborah C | $125,000 | -- | |
| Turner Mark K Glenda B | -- | -- | |
| Mark Turner Builders Inc | $25,000 | -- | |
| Simon Albert S | -- | -- | |
| Simon Albert S Jr Patricia R | $10,000 | -- |
Source: Public Records
Tax History Compared to Growth
Tax History
| Year | Tax Paid | Tax Assessment Tax Assessment Total Assessment is a certain percentage of the fair market value that is determined by local assessors to be the total taxable value of land and additions on the property. | Land | Improvement |
|---|---|---|---|---|
| 2025 | $1,895 | $461,600 | $61,200 | $400,400 |
| 2023 | $1,895 | $348,500 | $60,400 | $288,100 |
| 2022 | $1,906 | $348,500 | $60,400 | $288,100 |
| 2021 | $1,920 | $348,500 | $60,400 | $288,100 |
| 2020 | $1,770 | $279,900 | $46,900 | $233,000 |
| 2019 | $1,770 | $279,900 | $46,900 | $233,000 |
| 2018 | $1,770 | $279,900 | $46,900 | $233,000 |
| 2017 | $1,812 | $279,900 | $46,900 | $233,000 |
| 2016 | $1,519 | $219,200 | $82,700 | $136,500 |
| 2015 | $1,412 | $219,200 | $82,700 | $136,500 |
| 2014 | $1,388 | $219,200 | $82,700 | $136,500 |
Source: Public Records
Map
Nearby Homes
- 5011 Marathon Landing Ct
- 5019 Marathon Landing Ct
- 3451 Marathon Ave
- 112 Bavarian Dr
- 129 Brookgreen Rd
- 119 McDougald Dr
- 3830 Sondey Rd
- 1205 Pampas Grass Dr
- 1205 Pampas Grass Dr Unit Lot 462
- 1296 Sabal Palm St Unit Lot 472
- 4121 Castle Hayne Rd
- 3420 Lynn Ave
- 3921 Marathon Ave
- 2 Castle Farms Rd
- 3 Castle Farms Rd
- 3637 Lynn Ave
- 5207 5207 Castle Hayne Rd Rd
- 1017 Pine Ridge Ct
- 304 Mary Ave
- 697 Jenoa Loop
- 4838 Indian Corn Trail
- 4900 Indian Corn Trail
- 4832 Indian Corn Trail
- 4901 Indian Corn Trail
- 4826 Indian Corn Trail
- 4911 Indian Corn Trail
- 4820 Indian Corn Trail
- 4822 Indian Corn Trail
- 4916 Indian Corn Trail
- 4917 Indian Corn Trail
- 108 Tall Oaks Dr
- 4816 Indian Corn Trail
- 4924 Indian Corn Trail
- 4801 Indian Corn Trail
- 4927 Indian Corn Trail
- 4701 Indian Corn Trail
- 4717 Indian Corn Trail
- 4930 Indian Corn Trail
- 3120 Marathon Ave
- 104 Tall Oaks Dr