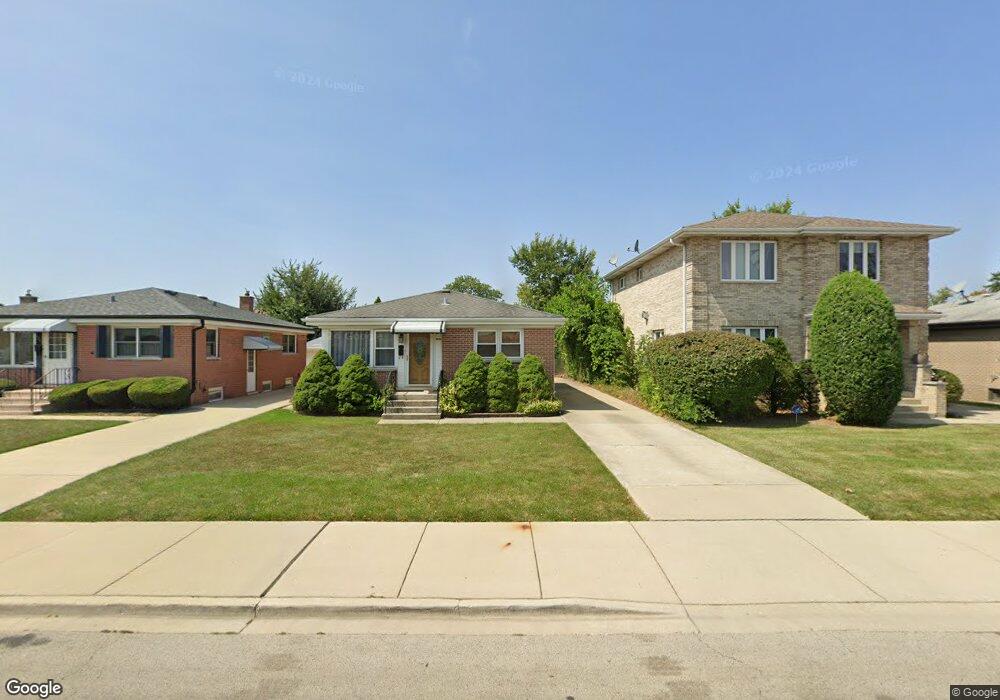
4844 N Overhill Ave Norridge, IL 60706
Estimated Value: $385,000 - $469,000
3
Beds
2
Baths
981
Sq Ft
$439/Sq Ft
Est. Value
About This Home
This home is located at 4844 N Overhill Ave, Norridge, IL 60706 and is currently estimated at $430,270, approximately $438 per square foot. 4844 N Overhill Ave is a home located in Cook County with nearby schools including J Giles Elementary School, Ridgewood Community High School, and St Eugene School.
Ownership History
Date
Name
Owned For
Owner Type
Purchase Details
Closed on
Jun 30, 2008
Sold by
Palmisano Sam and Palmisano Marina
Bought by
Evola Joseph and Evola Nicole M
Current Estimated Value
Home Financials for this Owner
Home Financials are based on the most recent Mortgage that was taken out on this home.
Original Mortgage
$320,000
Outstanding Balance
$205,287
Interest Rate
5.96%
Mortgage Type
Unknown
Estimated Equity
$224,983
Purchase Details
Closed on
Mar 24, 2005
Sold by
Mika Monika and Mika Czeslaw
Bought by
Palmisano Sam and Palmisano Marina
Home Financials for this Owner
Home Financials are based on the most recent Mortgage that was taken out on this home.
Original Mortgage
$244,000
Interest Rate
5.64%
Mortgage Type
Unknown
Purchase Details
Closed on
Mar 1, 1996
Sold by
Zuba Kazimierz and Zuba Maria
Bought by
Mika Czeslaw and Mika Monika
Home Financials for this Owner
Home Financials are based on the most recent Mortgage that was taken out on this home.
Original Mortgage
$55,000
Interest Rate
7.06%
Create a Home Valuation Report for This Property
The Home Valuation Report is an in-depth analysis detailing your home's value as well as a comparison with similar homes in the area
Home Values in the Area
Average Home Value in this Area
Purchase History
| Date | Buyer | Sale Price | Title Company |
|---|---|---|---|
| Evola Joseph | $362,500 | Cti | |
| Palmisano Sam | $364,000 | Marquis Title | |
| Mika Czeslaw | $198,000 | Attorneys Natl Title Network |
Source: Public Records
Mortgage History
| Date | Status | Borrower | Loan Amount |
|---|---|---|---|
| Open | Evola Joseph | $320,000 | |
| Previous Owner | Palmisano Sam | $244,000 | |
| Previous Owner | Mika Czeslaw | $55,000 |
Source: Public Records
Tax History Compared to Growth
Tax History
| Year | Tax Paid | Tax Assessment Tax Assessment Total Assessment is a certain percentage of the fair market value that is determined by local assessors to be the total taxable value of land and additions on the property. | Land | Improvement |
|---|---|---|---|---|
| 2024 | $6,149 | $28,996 | $6,825 | $22,171 |
| 2023 | $5,973 | $30,000 | $6,825 | $23,175 |
| 2022 | $5,973 | $30,000 | $6,825 | $23,175 |
| 2021 | $5,036 | $23,131 | $6,037 | $17,094 |
| 2020 | $4,965 | $23,131 | $6,037 | $17,094 |
| 2019 | $4,953 | $25,961 | $6,037 | $19,924 |
| 2018 | $4,569 | $21,321 | $4,987 | $16,334 |
| 2017 | $4,471 | $21,321 | $4,987 | $16,334 |
| 2016 | $4,420 | $21,321 | $4,987 | $16,334 |
| 2015 | $4,537 | $20,439 | $4,331 | $16,108 |
| 2014 | $4,665 | $21,165 | $4,331 | $16,834 |
| 2013 | $4,556 | $21,165 | $4,331 | $16,834 |
Source: Public Records
Map
Nearby Homes
- 7641 W Ainslie St
- 7650 W Lawrence Ave Unit 201
- 7632 W Norridge St
- 4937 N Ozanam Ave
- 7616 W Lawrence Ave Unit 3A
- 7636 W Strong St
- 7604 W Lawrence Ave Unit 1B
- 4712 N Ozark Ave
- 7519 W Argyle St
- 7502 W Strong St
- 4833 N Olcott Ave Unit 307
- 4935 N Frank Pkwy
- 4621 N Ozanam Ave
- 7501 W Winnemac Ave
- 7716 W Winona St
- 5161 N Moreland Ave
- 7410 W Lawrence Ave Unit 115
- 7511 W Foster Ave
- 7805 W Farragut Ave
- 7809 W Farragut Ave
- 4840 N Overhill Ave
- 4848 N Overhill Ave
- 4836 N Overhill Ave
- 4852 N Overhill Ave
- 4845 N Ozark Ave
- 4832 N Overhill Ave
- 4900 N Overhill Ave
- 4849 N Ozark Ave
- 4841 N Ozark Ave
- 7657 W Ainslie St
- 7656 W Gunnison St
- 4853 N Ozark Ave
- 4837 N Ozark Ave
- 4828 N Overhill Ave
- 4904 N Overhill Ave
- 4901 N Ozark Ave
- 7653 W Ainslie St
- 4833 N Ozark Ave
- 4905 N Ozark Ave