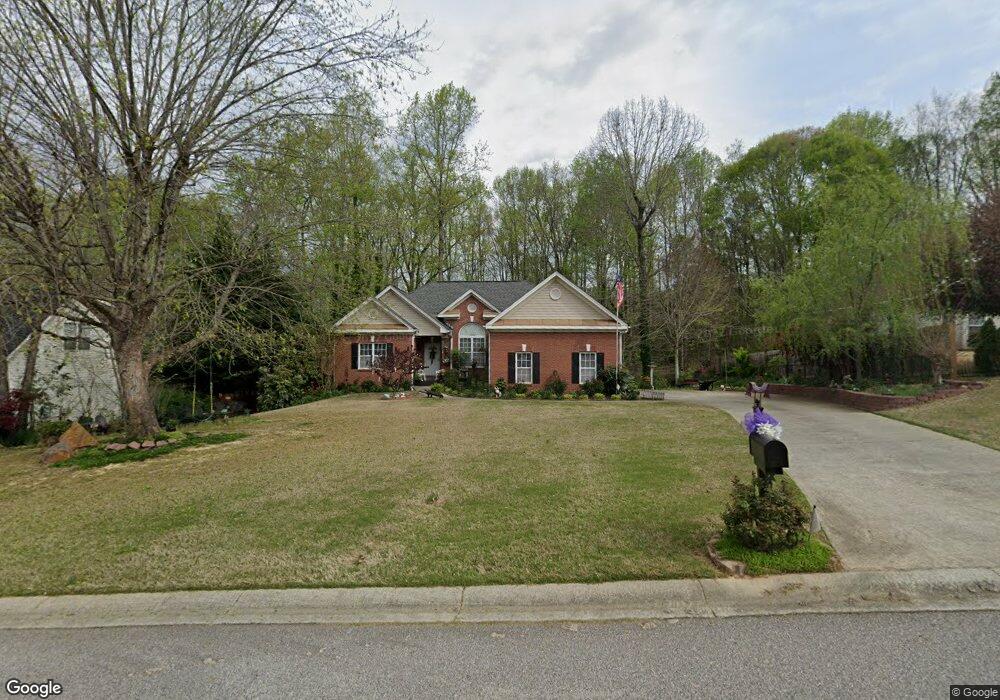
4844 Netherlands Place Flowery Branch, GA 30542
Estimated Value: $399,082 - $458,000
3
Beds
2
Baths
1,782
Sq Ft
$243/Sq Ft
Est. Value
About This Home
This home is located at 4844 Netherlands Place, Flowery Branch, GA 30542 and is currently estimated at $433,771, approximately $243 per square foot. 4844 Netherlands Place is a home located in Hall County with nearby schools including Martin Elementary School, Southwest Middle School, and C.W. Davis Middle School.
Ownership History
Date
Name
Owned For
Owner Type
Purchase Details
Closed on
Jan 25, 2018
Sold by
Sanders Jake
Bought by
Sanders Kinnie
Current Estimated Value
Purchase Details
Closed on
May 16, 2016
Sold by
Sanders Jake
Bought by
Sanders Jake and Sanders Klnnie Therisa
Purchase Details
Closed on
Feb 11, 2005
Sold by
Chitwood Keith D
Bought by
Sanders Jake
Home Financials for this Owner
Home Financials are based on the most recent Mortgage that was taken out on this home.
Original Mortgage
$164,000
Interest Rate
5.63%
Mortgage Type
New Conventional
Purchase Details
Closed on
Jan 7, 2002
Sold by
Chitwood Keith D
Bought by
Black Laura S and Raymond Gary
Home Financials for this Owner
Home Financials are based on the most recent Mortgage that was taken out on this home.
Original Mortgage
$169,900
Interest Rate
7.07%
Purchase Details
Closed on
May 9, 2000
Sold by
New Age Development Llc
Bought by
Chitwood Keith D
Purchase Details
Closed on
Sep 20, 1999
Sold by
Zonnenberg Martin B P
Bought by
New Age Development Llc
Create a Home Valuation Report for This Property
The Home Valuation Report is an in-depth analysis detailing your home's value as well as a comparison with similar homes in the area
Home Values in the Area
Average Home Value in this Area
Purchase History
| Date | Buyer | Sale Price | Title Company |
|---|---|---|---|
| Sanders Kinnie | -- | -- | |
| Sanders Jake | -- | -- | |
| Sanders Jake | $205,000 | -- | |
| Black Laura S | $179,900 | -- | |
| Chitwood Keith D | -- | -- | |
| New Age Development Llc | $217,100 | -- |
Source: Public Records
Mortgage History
| Date | Status | Borrower | Loan Amount |
|---|---|---|---|
| Previous Owner | Sanders Jake | $164,000 | |
| Previous Owner | Black Laura S | $169,900 |
Source: Public Records
Tax History Compared to Growth
Tax History
| Year | Tax Paid | Tax Assessment Tax Assessment Total Assessment is a certain percentage of the fair market value that is determined by local assessors to be the total taxable value of land and additions on the property. | Land | Improvement |
|---|---|---|---|---|
| 2024 | $1,504 | $168,720 | $29,080 | $139,640 |
| 2023 | $1,207 | $144,640 | $11,080 | $133,560 |
| 2022 | $1,203 | $120,800 | $11,080 | $109,720 |
| 2021 | $1,196 | $113,520 | $11,080 | $102,440 |
| 2020 | $1,179 | $109,320 | $11,080 | $98,240 |
| 2019 | $1,149 | $103,600 | $11,080 | $92,520 |
| 2018 | $1,098 | $95,800 | $11,080 | $84,720 |
| 2017 | $2,577 | $88,720 | $11,080 | $77,640 |
| 2016 | $2,517 | $88,720 | $11,080 | $77,640 |
| 2015 | $1,835 | $63,622 | $7,720 | $55,902 |
| 2014 | $1,835 | $63,622 | $7,720 | $55,902 |
Source: Public Records
Map
Nearby Homes
- 4838 Netherlands Place
- 4743 Amsterdam Ln
- 4684 Martins Crossing Dr W
- 3929 Perry Ln
- 4708 Upper Berkshire Rd Unit 39
- 5061 Pointer Ridge
- 4086 Parks Rd
- 5055 Pointer Ridge
- 4860 Wildlife Way
- 4610 Blakeford Ct
- 4434 Oxburgh Park
- 4835 Upper Berkshire Rd
- 4439 Oxburgh Park
- 4446 Union Church Rd
- 4020 Parks Rd
- 4478 Longmead Rd
- 4626 Deer Creek Ct
- 4621 Stanley Rd
- 4850 Netherlands Place
- 4845 Netherlands Place
- 4832 Netherlands Place
- 4839 Netherlands Place
- 0 Netherlands Place Unit 8198385
- 0 Netherlands Place Unit 3012868
- 0 Netherlands Place Unit 7249524
- 0 Netherlands Place Unit 7413964
- 4851 Netherlands Place
- 4856 Netherlands Place
- 4833 Netherlands Place
- 4833 Netherlands Place Unit 12
- 4826 Netherlands Place
- 4095 Chestnut Dr
- 4081 Chestnut Dr
- 4857 Netherlands Place
- 4862 Netherlands Place
- 4075 Chestnut Dr
- 4827 Netherlands Place
- 4067 Chestnut Dr