Estimated Value: $311,000 - $378,000
2
Beds
1
Bath
1,300
Sq Ft
$266/Sq Ft
Est. Value
About This Home
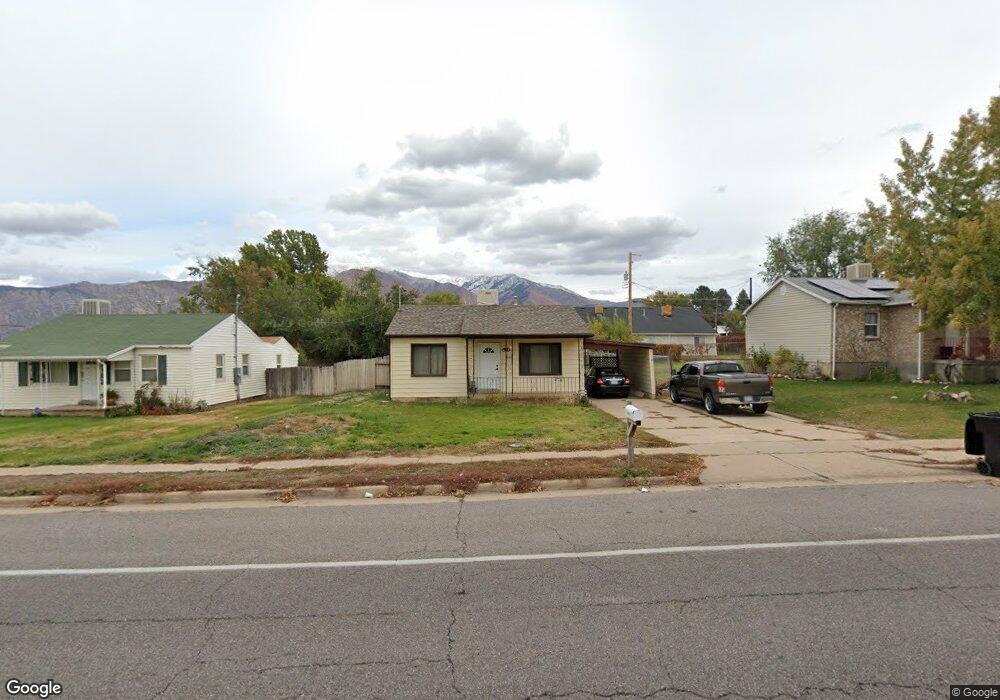
This home is located at 4844 S 300 W, Ogden, UT 84405 and is currently estimated at $345,208, approximately $265 per square foot. 4844 S 300 W is a home located in Weber County with nearby schools including Roosevelt School, T.H. Bell Junior High School, and Bonneville High School.
Ownership History
Date
Name
Owned For
Owner Type
Purchase Details
Closed on
Sep 10, 2013
Sold by
Baltazar Brett and Baltazar Jodee
Bought by
Atwood Joshua A
Current Estimated Value
Home Financials for this Owner
Home Financials are based on the most recent Mortgage that was taken out on this home.
Original Mortgage
$106,043
Outstanding Balance
$79,007
Interest Rate
4.36%
Mortgage Type
FHA
Estimated Equity
$266,201
Purchase Details
Closed on
Dec 26, 2006
Sold by
Butler Jo and Sorensen Jo
Bought by
Baltazar Brett
Create a Home Valuation Report for This Property
The Home Valuation Report is an in-depth analysis detailing your home's value as well as a comparison with similar homes in the area
Home Values in the Area
Average Home Value in this Area
Purchase History
| Date | Buyer | Sale Price | Title Company |
|---|---|---|---|
| Atwood Joshua A | -- | Bonneville Superior Title Co | |
| Baltazar Brett | -- | Founders Title Company Syrac |
Source: Public Records
Mortgage History
| Date | Status | Borrower | Loan Amount |
|---|---|---|---|
| Open | Atwood Joshua A | $106,043 |
Source: Public Records
Tax History Compared to Growth
Tax History
| Year | Tax Paid | Tax Assessment Tax Assessment Total Assessment is a certain percentage of the fair market value that is determined by local assessors to be the total taxable value of land and additions on the property. | Land | Improvement |
|---|---|---|---|---|
| 2025 | $1,394 | $185,555 | $110,007 | $75,548 |
| 2024 | $1,394 | $100,649 | $60,503 | $40,146 |
| 2023 | $1,784 | $139,700 | $60,474 | $79,226 |
| 2022 | $1,752 | $142,450 | $57,750 | $84,700 |
| 2021 | $1,415 | $183,000 | $55,013 | $127,987 |
| 2020 | $1,432 | $171,000 | $44,967 | $126,033 |
| 2019 | $1,499 | $168,000 | $44,967 | $123,033 |
| 2018 | $1,168 | $122,000 | $44,967 | $77,033 |
| 2017 | $1,114 | $108,000 | $33,966 | $74,034 |
| 2016 | $991 | $51,091 | $18,072 | $33,019 |
| 2015 | $971 | $48,983 | $18,072 | $30,911 |
| 2014 | $968 | $48,848 | $18,072 | $30,776 |
Source: Public Records
Map
Nearby Homes