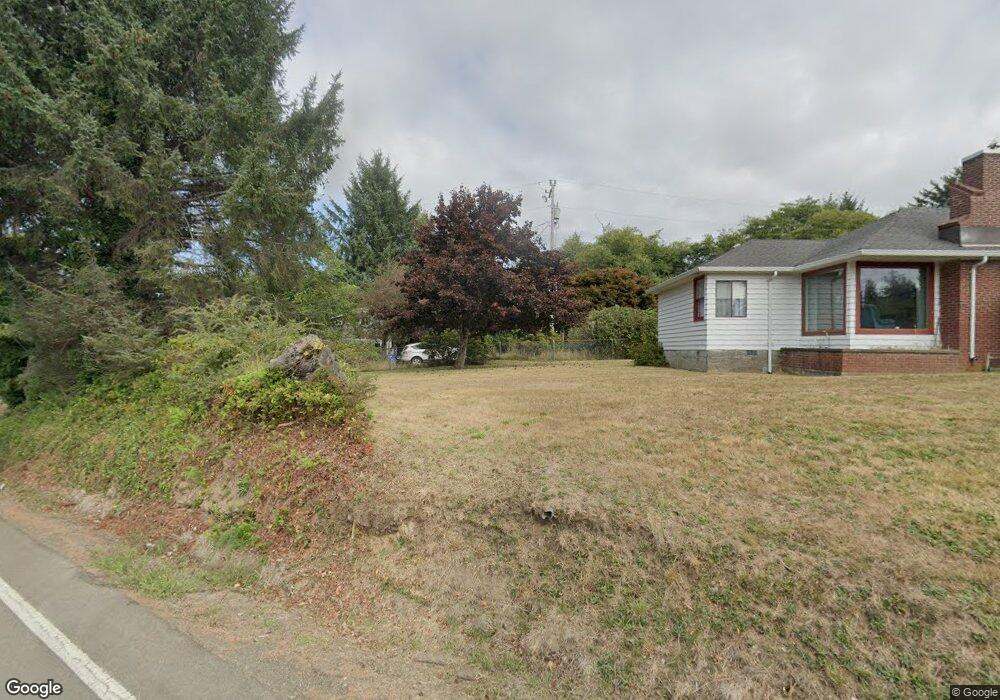
4845 John R St W Tillamook, OR 97141
Estimated Value: $494,000 - $544,000
3
Beds
2
Baths
1,667
Sq Ft
$311/Sq Ft
Est. Value
About This Home
This home is located at 4845 John R St W, Tillamook, OR 97141 and is currently estimated at $518,377, approximately $310 per square foot. 4845 John R St W is a home located in Tillamook County with nearby schools including Tillamook High School.
Ownership History
Date
Name
Owned For
Owner Type
Purchase Details
Closed on
Sep 11, 2015
Sold by
Fannie Mae
Bought by
Hendricks Nichole M
Current Estimated Value
Home Financials for this Owner
Home Financials are based on the most recent Mortgage that was taken out on this home.
Original Mortgage
$201,286
Outstanding Balance
$157,228
Interest Rate
3.75%
Mortgage Type
FHA
Estimated Equity
$361,149
Purchase Details
Closed on
Oct 8, 2014
Sold by
Mcalexander Jason M and Taliaferro Tami D
Bought by
Federal National Mortgage Association
Purchase Details
Closed on
Oct 12, 2005
Sold by
Armstrong Peter S
Bought by
Mcalexander Jason M and Taliaferro Tami D
Home Financials for this Owner
Home Financials are based on the most recent Mortgage that was taken out on this home.
Original Mortgage
$224,100
Interest Rate
7.37%
Mortgage Type
Fannie Mae Freddie Mac
Create a Home Valuation Report for This Property
The Home Valuation Report is an in-depth analysis detailing your home's value as well as a comparison with similar homes in the area
Home Values in the Area
Average Home Value in this Area
Purchase History
| Date | Buyer | Sale Price | Title Company |
|---|---|---|---|
| Hendricks Nichole M | $205,000 | Multiple | |
| Federal National Mortgage Association | $247,138 | None Available | |
| Mcalexander Jason M | $249,000 | Ticor Title Ins Co |
Source: Public Records
Mortgage History
| Date | Status | Borrower | Loan Amount |
|---|---|---|---|
| Open | Hendricks Nichole M | $201,286 | |
| Previous Owner | Mcalexander Jason M | $224,100 |
Source: Public Records
Tax History Compared to Growth
Tax History
| Year | Tax Paid | Tax Assessment Tax Assessment Total Assessment is a certain percentage of the fair market value that is determined by local assessors to be the total taxable value of land and additions on the property. | Land | Improvement |
|---|---|---|---|---|
| 2024 | $3,076 | $243,780 | $71,740 | $172,040 |
| 2023 | $3,064 | $236,680 | $69,650 | $167,030 |
| 2022 | $2,979 | $229,790 | $67,620 | $162,170 |
| 2021 | $2,911 | $223,100 | $65,650 | $157,450 |
| 2020 | $2,847 | $216,610 | $63,740 | $152,870 |
| 2019 | $2,789 | $210,310 | $61,880 | $148,430 |
| 2018 | $2,735 | $204,190 | $60,080 | $144,110 |
| 2017 | $2,682 | $198,249 | $58,329 | $139,920 |
| 2016 | $2,597 | $192,480 | $56,630 | $135,850 |
| 2015 | $2,558 | $186,880 | $54,980 | $131,900 |
| 2014 | $3,257 | $181,440 | $53,380 | $128,060 |
| 2013 | -- | $176,160 | $51,830 | $124,330 |
Source: Public Records
Map
Nearby Homes
- 4805 Leonard St W
- 4830 Netarts Hwy W
- 4850 Netarts Hwy W Unit 6
- 4745 Netarts Hwy W
- TL 3800 Vista View Dr W
- 4803 Holly Heights Ave
- 0 Tl 3800 Unit 479246395
- 218 Holly Heights Ave
- 223 Holly Heights Ave
- 224 Holly Heights Ave
- 1540 Vista View Dr W
- 1960 Alder Cove Rd W
- 0 Moondancer Ln Unit 25-198
- 0 Moondancer Ln Unit 62
- 1480 Emerald Ln
- 4380 Sequoia Loop
- 4900 Clam Way
- VL Sequoia Loop
- 116 Sequoia Loop
- 4300 Sequoia Loop
- 4845 John R Rd W
- 4855 John R St W
- 4855 John R Rd W
- 4835 John R St W
- 4845 Silversands St W
- 4845 John R St
- 4835 Silversands St W
- 4855 Silversands St W
- 4825 John R St W
- 4825 Silversands St W
- 4828 Alder Cove Rd W
- 4815 John R Rd W
- 4815 John R St W
- 5070 Clam Ave
- 1080 Firststreet
- 4820 Alder Cove Rd W
- 4815 Silversands St W
- 4810 John R St W
- TBD Old State Rd W
- 4825 Netarts Hwy W