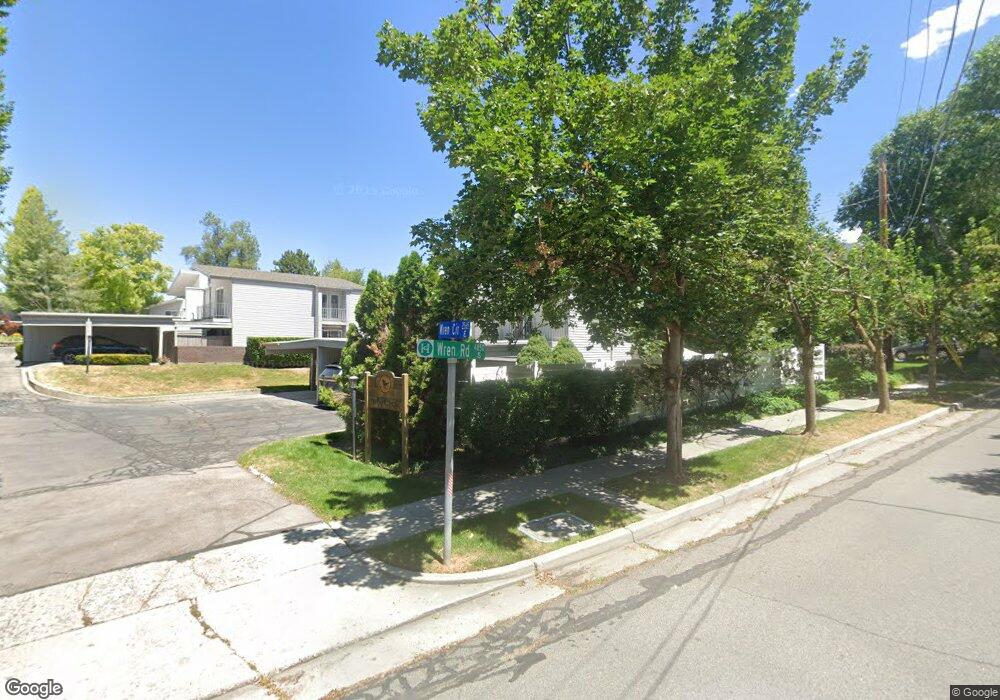
4845 S Wren Cir Unit 2 Salt Lake City, UT 84117
Estimated Value: $425,764 - $724,000
2
Beds
2
Baths
1,190
Sq Ft
$446/Sq Ft
Est. Value
About This Home
This home is located at 4845 S Wren Cir Unit 2, Salt Lake City, UT 84117 and is currently estimated at $530,941, approximately $446 per square foot. 4845 S Wren Cir Unit 2 is a home located in Salt Lake County with nearby schools including Howard R Driggs School, Olympus Junior High School, and Olympus High School.
Ownership History
Date
Name
Owned For
Owner Type
Purchase Details
Closed on
Feb 27, 2020
Sold by
Tazoi Kristen and Tazoi Jordan
Bought by
Gonzalez Gerardo
Current Estimated Value
Home Financials for this Owner
Home Financials are based on the most recent Mortgage that was taken out on this home.
Original Mortgage
$299,250
Outstanding Balance
$265,029
Interest Rate
3.5%
Mortgage Type
New Conventional
Estimated Equity
$265,912
Purchase Details
Closed on
Oct 23, 2017
Sold by
Calder Jeffrey T
Bought by
Tazoi Kristen and Tazoi Jordan
Home Financials for this Owner
Home Financials are based on the most recent Mortgage that was taken out on this home.
Original Mortgage
$225,000
Interest Rate
3.78%
Mortgage Type
New Conventional
Purchase Details
Closed on
Mar 28, 2008
Sold by
Calder Larry
Bought by
Calder Larry S and Larry S Calder Amended & Restated Trust
Purchase Details
Closed on
Apr 22, 2004
Sold by
Calder Larry
Bought by
Calder Larry
Create a Home Valuation Report for This Property
The Home Valuation Report is an in-depth analysis detailing your home's value as well as a comparison with similar homes in the area
Home Values in the Area
Average Home Value in this Area
Purchase History
| Date | Buyer | Sale Price | Title Company |
|---|---|---|---|
| Gonzalez Gerardo | -- | Cottonwood Title | |
| Tazoi Kristen | -- | Stewart Title Ins Agcy Of Ut | |
| Calder Larry S | -- | First American Title | |
| Calder Larry | -- | Brighton Title |
Source: Public Records
Mortgage History
| Date | Status | Borrower | Loan Amount |
|---|---|---|---|
| Open | Gonzalez Gerardo | $299,250 | |
| Previous Owner | Tazoi Kristen | $225,000 |
Source: Public Records
Tax History Compared to Growth
Tax History
| Year | Tax Paid | Tax Assessment Tax Assessment Total Assessment is a certain percentage of the fair market value that is determined by local assessors to be the total taxable value of land and additions on the property. | Land | Improvement |
|---|---|---|---|---|
| 2025 | $622 | $436,800 | $131,000 | $305,800 |
| 2024 | $622 | $443,300 | $133,000 | $310,300 |
| 2023 | $573 | $423,300 | $127,000 | $296,300 |
| 2022 | $489 | $410,500 | $123,100 | $287,400 |
| 2021 | $190 | $310,500 | $93,100 | $217,400 |
| 2020 | $1,832 | $279,600 | $83,900 | $195,700 |
| 2019 | $1,866 | $277,300 | $83,200 | $194,100 |
| 2018 | $1,681 | $241,700 | $72,500 | $169,200 |
| 2017 | $1,317 | $200,000 | $60,000 | $140,000 |
| 2016 | $1,166 | $178,000 | $53,400 | $124,600 |
| 2015 | $1,190 | $169,400 | $50,800 | $118,600 |
| 2014 | $1,197 | $167,700 | $50,300 | $117,400 |
Source: Public Records
Map
Nearby Homes
- 2584 E Wren Rd
- 4881 S Holladay Blvd
- 2164 E Rising Wolf Ln S Unit 20
- 2168 E Rising Wolf Ln S Unit 18
- 1757 E Water Pine Ct S Unit 105
- 1749 E Water Pine Ct Unit 102
- 1751 E Water Pine Ct S Unit 103
- 1753 E Water Pine Ct S Unit 104
- 2567 E Kentucky Ave
- 4650 S Chapel Dr
- 2633 E Casto Ln
- 2494 E Murray Holladay Rd
- 2665 Kentucky Ave
- 2694 E Kentucky Ave
- 2490 E Murray Holladay Rd
- 2508 E Murray Holladay Rd
- 2620 E Casto Ln
- 2451 E Murray Holladay Rd
- 2270 E Murray Holladay Rd Unit 8
- 2369 E Murray Holladay Rd Unit 107
- 4845 S Wren Cir Unit 1
- 4845 S Wren Cir Unit 1
- 4845 S Wren Cir Unit 2
- 4841 S Wren Cir Unit 4
- 4841 S Wren Cir Unit 3
- 2583 Wren Rd
- 2583 E Wren Rd
- 4835 Wren Cir Unit 5
- 4835 Wren Cir Unit 6
- 2553 E Wren Rd
- 4835 S Wren Cir Unit 6
- 4835 S Wren Cir
- 4835 S Wren Cir Unit 5
- 2580 E Valley View Ave
- 2553 Wren Rd Unit 2555
- 2564 Wren Rd
- 2564 E Wren Rd
- 2576 Wren Rd
- 4841 Wren Cir Unit 3
- 4841 Wren Cir Unit 4