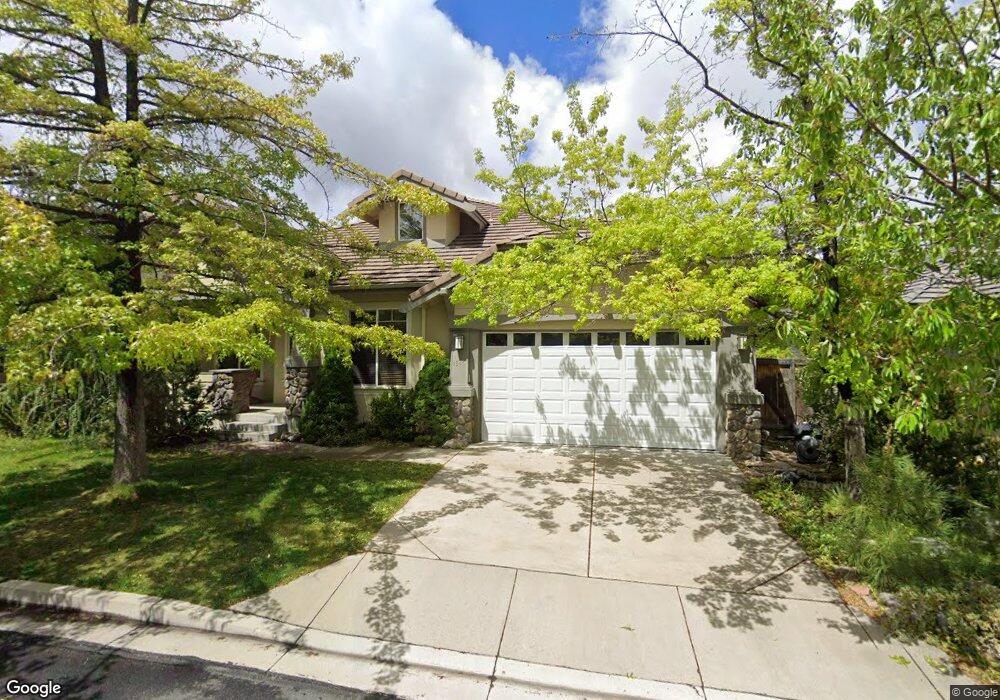
4845 Turning Leaf Way Reno, NV 89519
South Outer Reno NeighborhoodEstimated Value: $918,000 - $1,276,000
4
Beds
4
Baths
3,267
Sq Ft
$335/Sq Ft
Est. Value
About This Home
This home is located at 4845 Turning Leaf Way, Reno, NV 89519 and is currently estimated at $1,095,031, approximately $335 per square foot. 4845 Turning Leaf Way is a home located in Washoe County with nearby schools including Caughlin Ranch Elementary School, Darrell C Swope Middle School, and Reno High School.
Ownership History
Date
Name
Owned For
Owner Type
Purchase Details
Closed on
Mar 18, 2015
Sold by
Shapiro Hugh L and Liu Limin
Bought by
Shapiro Hugh L and Liu Limin
Current Estimated Value
Purchase Details
Closed on
Dec 13, 2013
Sold by
Kleinman Mike and Groman Pamela
Bought by
Northern Nevada Capital Llc
Purchase Details
Closed on
Sep 12, 2013
Sold by
Kleinman Debbie
Bought by
Kleinman Mike and Groman Pamela
Purchase Details
Closed on
Nov 2, 2009
Sold by
Elpern Jeffrey J and Elpern Sheri A
Bought by
Shapiro Hugh and Liu Limin
Purchase Details
Closed on
Nov 27, 2001
Sold by
Maddox Charles B
Bought by
Elpern Jeffrey J and Elpern Sheri A
Home Financials for this Owner
Home Financials are based on the most recent Mortgage that was taken out on this home.
Original Mortgage
$406,250
Interest Rate
6.63%
Mortgage Type
Stand Alone First
Create a Home Valuation Report for This Property
The Home Valuation Report is an in-depth analysis detailing your home's value as well as a comparison with similar homes in the area
Home Values in the Area
Average Home Value in this Area
Purchase History
| Date | Buyer | Sale Price | Title Company |
|---|---|---|---|
| Shapiro Hugh L | -- | North American Title Reno | |
| Northern Nevada Capital Llc | $205,000 | None Available | |
| Kleinman Mike | -- | None Available | |
| Shapiro Hugh | $510,000 | First Centennial Reno | |
| Elpern Jeffrey J | $510,500 | Western Title Inc |
Source: Public Records
Mortgage History
| Date | Status | Borrower | Loan Amount |
|---|---|---|---|
| Previous Owner | Elpern Jeffrey J | $406,250 |
Source: Public Records
Tax History Compared to Growth
Tax History
| Year | Tax Paid | Tax Assessment Tax Assessment Total Assessment is a certain percentage of the fair market value that is determined by local assessors to be the total taxable value of land and additions on the property. | Land | Improvement |
|---|---|---|---|---|
| 2026 | $2,796 | $215,555 | $66,220 | $149,335 |
| 2025 | $5,436 | $208,894 | $61,810 | $147,084 |
| 2024 | $5,436 | $203,565 | $55,055 | $148,510 |
| 2023 | $5,279 | $200,923 | $58,765 | $142,158 |
| 2022 | $5,125 | $164,369 | $47,180 | $117,189 |
| 2021 | $4,977 | $151,711 | $35,280 | $116,431 |
| 2020 | $4,829 | $152,802 | $34,860 | $117,942 |
| 2019 | $4,689 | $144,557 | $31,885 | $112,672 |
| 2018 | $4,553 | $136,799 | $26,320 | $110,479 |
| 2017 | $4,420 | $133,467 | $22,855 | $110,612 |
| 2016 | $4,309 | $133,870 | $21,525 | $112,345 |
| 2015 | $4,302 | $134,420 | $21,245 | $113,175 |
| 2014 | $4,176 | $129,520 | $19,530 | $109,990 |
| 2013 | -- | $110,576 | $18,900 | $91,676 |
Source: Public Records
Map
Nearby Homes
- 3381 Cheechako Dr
- 1005 Stag Ridge Ct Unit 5
- 3790 Ranch Crest Dr
- 1890 Hunter Creek Rd
- 1860 Hunter Creek Rd
- 3678 Brighton Way
- 2790 W Lakeridge Shores
- 3680 Ranch Crest Dr
- 20 Promontory Pointe
- 4052 Caughlin Creek Rd
- 5020 Fyvie Ct Unit 4
- 4720 Ellicott Way
- 4559 Village Green Pkwy
- 4120 Flintlock Cir
- 1205 Greensburg Cir
- 4283 Water Hole Rd
- 4990 Mountainshyre Rd
- 1570 Caughlin Creek Rd
- 3915 Innsbruck Ct Unit 2B
- 4840 Keshmiri Place
- 4835 Turning Leaf Way
- 4855 Turning Leaf Way
- 4825 Turning Leaf Way Unit 2
- 4861 Turning Leaf Way
- 4840 Turning Leaf Way
- 4830 Turning Leaf Way
- 4815 Turning Leaf Way Unit 2
- 4865 Turning Leaf Way Unit 2
- 4850 Turning Leaf Way
- 4810 Turning Leaf Way Unit 2
- 5060 Fall Colors Ct
- 4805 Turning Leaf Way
- 4860 Turning Leaf Way
- 4800 Turning Leaf Way
- 4871 Turning Leaf Way
- 5040 Fall Colors Ct
- 5061 Fall Colors Ct Unit 1
- 4870 Turning Leaf Way
- 4801 Turning Leaf Way