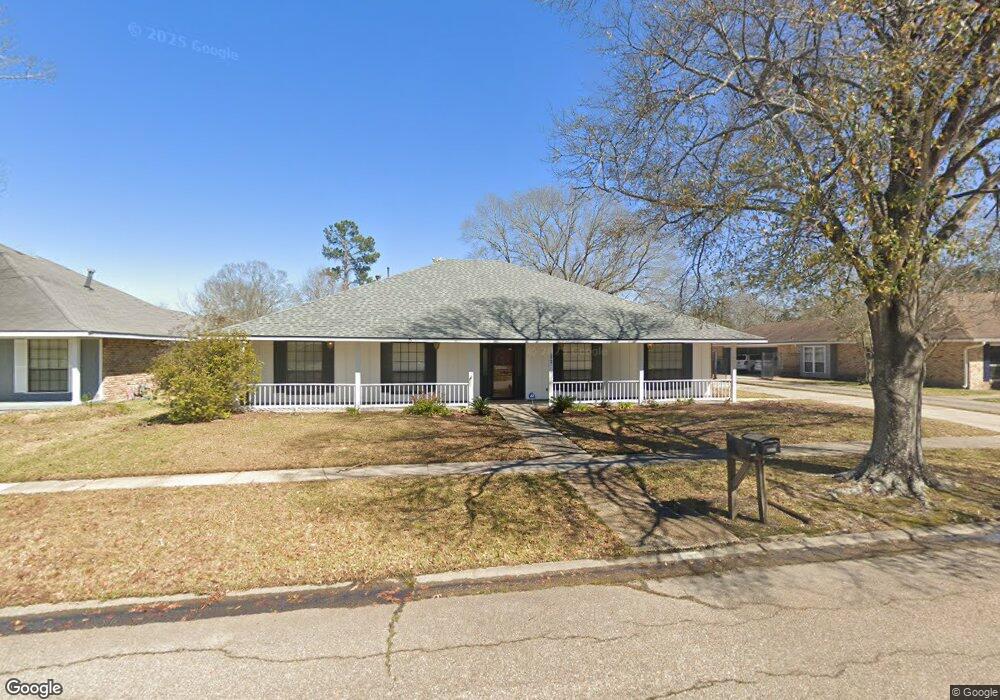
4847 Mobile Dr Baton Rouge, LA 70817
Shenandoah NeighborhoodEstimated Value: $317,000 - $368,000
4
Beds
3
Baths
2,400
Sq Ft
$140/Sq Ft
Est. Value
About This Home
This home is located at 4847 Mobile Dr, Baton Rouge, LA 70817 and is currently estimated at $335,899, approximately $139 per square foot. 4847 Mobile Dr is a home located in East Baton Rouge Parish with nearby schools including Shenandoah Elementary School, Woodlawn Middle School, and Woodlawn High School.
Ownership History
Date
Name
Owned For
Owner Type
Purchase Details
Closed on
Apr 30, 2008
Sold by
Taliaferro James G
Bought by
Mayard Chad M
Current Estimated Value
Home Financials for this Owner
Home Financials are based on the most recent Mortgage that was taken out on this home.
Original Mortgage
$211,678
Outstanding Balance
$133,774
Interest Rate
5.84%
Mortgage Type
FHA
Estimated Equity
$202,125
Purchase Details
Closed on
Feb 26, 2003
Sold by
William F Van Order Jr
Bought by
Taliaferro James Greg
Home Financials for this Owner
Home Financials are based on the most recent Mortgage that was taken out on this home.
Original Mortgage
$121,000
Interest Rate
5.93%
Mortgage Type
New Conventional
Purchase Details
Closed on
Jan 29, 2001
Sold by
Lacour Williams John Junius
Bought by
Vanorder William Frederick and Vanorder Cathy Lynne
Home Financials for this Owner
Home Financials are based on the most recent Mortgage that was taken out on this home.
Original Mortgage
$140,650
Interest Rate
7.43%
Create a Home Valuation Report for This Property
The Home Valuation Report is an in-depth analysis detailing your home's value as well as a comparison with similar homes in the area
Home Values in the Area
Average Home Value in this Area
Purchase History
| Date | Buyer | Sale Price | Title Company |
|---|---|---|---|
| Mayard Chad M | $215,000 | -- | |
| Taliaferro James Greg | $161,000 | -- | |
| Vanorder William Frederick | $145,000 | -- |
Source: Public Records
Mortgage History
| Date | Status | Borrower | Loan Amount |
|---|---|---|---|
| Open | Mayard Chad M | $211,678 | |
| Previous Owner | Taliaferro James Greg | $121,000 | |
| Previous Owner | Vanorder William Frederick | $140,650 |
Source: Public Records
Tax History Compared to Growth
Tax History
| Year | Tax Paid | Tax Assessment Tax Assessment Total Assessment is a certain percentage of the fair market value that is determined by local assessors to be the total taxable value of land and additions on the property. | Land | Improvement |
|---|---|---|---|---|
| 2024 | $2,621 | $29,440 | $2,000 | $27,440 |
| 2023 | $2,621 | $24,440 | $2,000 | $22,440 |
| 2022 | $2,849 | $24,440 | $2,000 | $22,440 |
| 2021 | $2,795 | $24,440 | $2,000 | $22,440 |
| 2020 | $2,831 | $24,440 | $2,000 | $22,440 |
| 2019 | $2,660 | $22,000 | $2,000 | $20,000 |
| 2018 | $2,627 | $22,000 | $2,000 | $20,000 |
| 2017 | $2,627 | $22,000 | $2,000 | $20,000 |
| 2016 | $919 | $15,000 | $2,000 | $13,000 |
| 2015 | $1,699 | $22,000 | $2,000 | $20,000 |
| 2014 | $1,664 | $22,000 | $2,000 | $20,000 |
| 2013 | -- | $22,000 | $2,000 | $20,000 |
Source: Public Records
Map
Nearby Homes
- 16849 Monitor Ave
- 16756 Merrimac Ave
- 16825 Chadsford Ave
- 4830 Kennesaw Dr Unit A
- 17237 Monitor Ave
- 4036 Copperridge Dr
- 17440 Beachwood Ave
- Lot 41A Carnifix Ct
- 16039 Haynes Bluff Ave
- 16225 Chadsford Ave
- 5101 Paducah Ct
- 5111 Paducah Ct
- 15844 Chantilly Ave
- 5534 Round Forrest Dr
- 3801 Villa Michel Dr
- 16103 Knoll Creek Ave
- 17633 E Fort Pickens Ave
- 16570 Spiller's
- 15946 Ferrell Ave
- 5821 Fort Sumpter Dr
- 4837 Mobile Dr
- 4911 Mobile Dr
- 4822 Five Forks Dr
- 4827 Mobile Dr
- 4921 Mobile Dr
- 4832 Five Forks Dr
- 4812 Five Forks Dr
- 4822 5 Forks Dr
- 4848 Mobile Dr
- 4832 5 Forks Dr
- 4838 Mobile Dr
- 4910 Mobile Dr
- 4842 Five Forks Dr
- 4802 Five Forks Dr
- 4931 Mobile Dr
- 4828 Mobile Dr
- 4817 Mobile Dr
- 4920 Mobile Dr
- 4914 Five Forks Dr
- 4914 5 Forks Dr