Estimated Value: $403,000 - $472,000
5
Beds
2
Baths
1,832
Sq Ft
$235/Sq Ft
Est. Value
About This Home
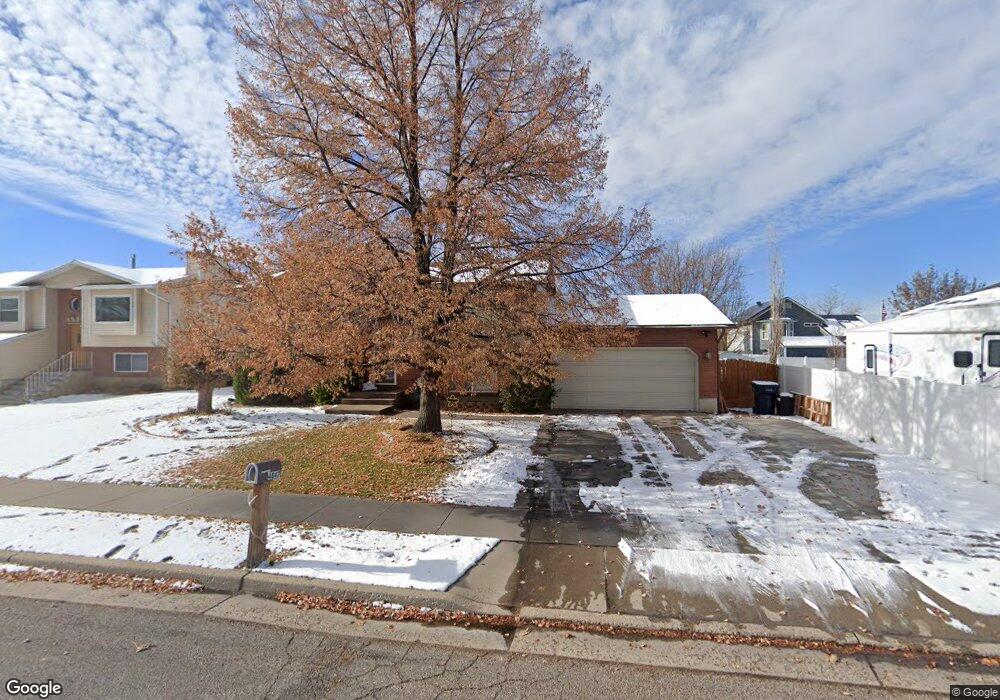
This home is located at 4847 S 3375 W, Roy, UT 84067 and is currently estimated at $430,050, approximately $234 per square foot. 4847 S 3375 W is a home located in Weber County with nearby schools including Midland School, Sand Ridge Junior High School, and Roy High School.
Ownership History
Date
Name
Owned For
Owner Type
Purchase Details
Closed on
Jun 10, 2013
Sold by
Bambrough Chad E and Bambrough Stacey L
Bought by
Atkinson Eric A and Atkinson Jeanne
Current Estimated Value
Home Financials for this Owner
Home Financials are based on the most recent Mortgage that was taken out on this home.
Original Mortgage
$156,600
Outstanding Balance
$110,799
Interest Rate
3.37%
Mortgage Type
New Conventional
Estimated Equity
$319,251
Purchase Details
Closed on
May 30, 2000
Sold by
Kezior Randall L and Kezior Nannette V
Bought by
Bambrough Chad E and Bambrough Stacey L
Home Financials for this Owner
Home Financials are based on the most recent Mortgage that was taken out on this home.
Original Mortgage
$125,665
Interest Rate
8.18%
Mortgage Type
FHA
Create a Home Valuation Report for This Property
The Home Valuation Report is an in-depth analysis detailing your home's value as well as a comparison with similar homes in the area
Home Values in the Area
Average Home Value in this Area
Purchase History
| Date | Buyer | Sale Price | Title Company |
|---|---|---|---|
| Atkinson Eric A | -- | Backman Title Services Ltd | |
| Bambrough Chad E | -- | U S Title |
Source: Public Records
Mortgage History
| Date | Status | Borrower | Loan Amount |
|---|---|---|---|
| Open | Atkinson Eric A | $156,600 | |
| Previous Owner | Bambrough Chad E | $125,665 |
Source: Public Records
Tax History
| Year | Tax Paid | Tax Assessment Tax Assessment Total Assessment is a certain percentage of the fair market value that is determined by local assessors to be the total taxable value of land and additions on the property. | Land | Improvement |
|---|---|---|---|---|
| 2025 | $2,542 | $401,585 | $131,089 | $270,496 |
| 2024 | $2,482 | $217,249 | $72,105 | $145,144 |
| 2023 | $2,307 | $201,300 | $64,894 | $136,406 |
| 2022 | $2,506 | $227,150 | $59,551 | $167,599 |
| 2021 | $1,980 | $293,000 | $78,213 | $214,787 |
| 2020 | $1,894 | $258,000 | $78,213 | $179,787 |
| 2019 | $1,834 | $235,000 | $43,596 | $191,404 |
| 2018 | $1,729 | $208,000 | $38,660 | $169,340 |
| 2017 | $1,525 | $170,000 | $38,660 | $131,340 |
| 2016 | $1,501 | $90,170 | $21,415 | $68,755 |
| 2015 | $1,363 | $83,375 | $21,415 | $61,960 |
| 2014 | $1,375 | $83,375 | $21,415 | $61,960 |
Source: Public Records
Map
Nearby Homes
- 3509 W 4835 S Unit 26
- 3517 W 4835 S Unit 27
- 3405 W 4525 S
- 5155 S 3200 W
- 3443 W 5200 S Unit 2&3
- 4510 Stone Creek Rd Unit F
- 4491 Haven Creek Rd Unit A
- 4793 S 3025 W
- 3022 W 4750 S
- 4435 Cross Creek Rd Unit 29C
- 3610 W 4475 S
- 4813 S 3850 W
- 4950 3900 West St
- 5009 S 2925 W
- 5141 S 2975 W
- 4891 S 2875 W
- 2953 W 4650 S
- 5321 S 3100 W
- 4324 S 3350 W
- 4322 S 3450 W
Your Personal Tour Guide
Ask me questions while you tour the home.