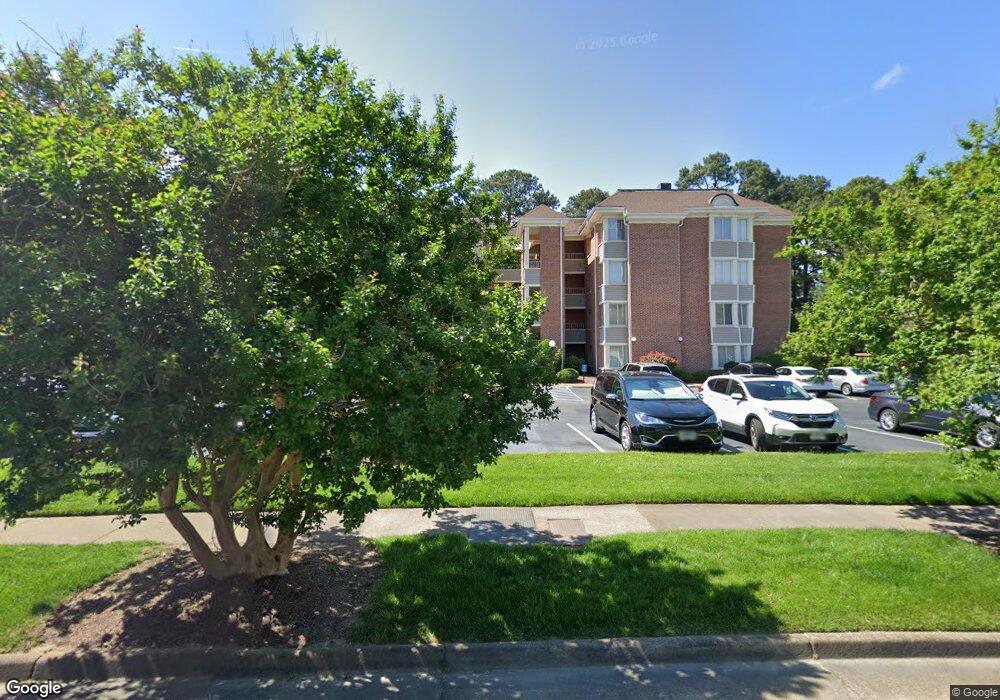
4848 Kempsville Greens Pkwy Unit 303 Virginia Beach, VA 23462
Estimated Value: $221,000 - $251,560
2
Beds
2
Baths
1,242
Sq Ft
$191/Sq Ft
Est. Value
About This Home
This home is located at 4848 Kempsville Greens Pkwy Unit 303, Virginia Beach, VA 23462 and is currently estimated at $236,890, approximately $190 per square foot. 4848 Kempsville Greens Pkwy Unit 303 is a home located in Virginia Beach City with nearby schools including Kempsville Meadows Elementary School, Larkspur Middle School, and Kempsville High School.
Ownership History
Date
Name
Owned For
Owner Type
Purchase Details
Closed on
May 27, 2022
Sold by
Bell Sr Temple B and Bell Cosima G
Bought by
Stone Seth T
Current Estimated Value
Home Financials for this Owner
Home Financials are based on the most recent Mortgage that was taken out on this home.
Original Mortgage
$198,462
Outstanding Balance
$188,106
Interest Rate
5%
Mortgage Type
VA
Estimated Equity
$48,784
Purchase Details
Closed on
Feb 5, 2016
Sold by
Martin Joshua W
Bought by
Bell Temple B and Bell Cosima G
Purchase Details
Closed on
Jun 30, 2008
Sold by
Allison Marilyn
Bought by
Martin Joshua W
Home Financials for this Owner
Home Financials are based on the most recent Mortgage that was taken out on this home.
Original Mortgage
$139,200
Interest Rate
6.07%
Mortgage Type
VA
Purchase Details
Closed on
Dec 15, 2003
Sold by
Steinberg Shirley
Bought by
Allison Marilyn
Create a Home Valuation Report for This Property
The Home Valuation Report is an in-depth analysis detailing your home's value as well as a comparison with similar homes in the area
Home Values in the Area
Average Home Value in this Area
Purchase History
| Date | Buyer | Sale Price | Title Company |
|---|---|---|---|
| Stone Seth T | $194,000 | Priority Title | |
| Bell Temple B | $131,000 | Attorney | |
| Martin Joshua W | $174,000 | -- | |
| Allison Marilyn | $128,200 | -- |
Source: Public Records
Mortgage History
| Date | Status | Borrower | Loan Amount |
|---|---|---|---|
| Open | Stone Seth T | $198,462 | |
| Previous Owner | Martin Joshua W | $139,200 |
Source: Public Records
Tax History Compared to Growth
Tax History
| Year | Tax Paid | Tax Assessment Tax Assessment Total Assessment is a certain percentage of the fair market value that is determined by local assessors to be the total taxable value of land and additions on the property. | Land | Improvement |
|---|---|---|---|---|
| 2025 | $1,948 | $214,800 | $85,000 | $129,800 |
| 2024 | $1,948 | $200,800 | $85,000 | $115,800 |
| 2023 | $1,835 | $185,400 | $75,000 | $110,400 |
| 2022 | $1,545 | $156,100 | $60,000 | $96,100 |
| 2021 | $1,463 | $147,800 | $52,000 | $95,800 |
| 2020 | $1,446 | $142,100 | $52,000 | $90,100 |
| 2019 | $1,383 | $127,800 | $52,000 | $75,800 |
| 2018 | $1,281 | $127,800 | $52,000 | $75,800 |
| 2017 | $1,300 | $129,700 | $52,000 | $77,700 |
| 2016 | $1,326 | $133,900 | $52,000 | $81,900 |
| 2015 | $1,336 | $134,900 | $52,000 | $82,900 |
| 2014 | $1,313 | $131,700 | $52,000 | $79,700 |
Source: Public Records
Map
Nearby Homes
- 4857 Haymarket Dr
- 4841 Haymarket Dr
- 514 Mulligan Dr
- 512 Mulligan Dr
- 4831 Parthenon Dr
- 4804 Oldwick Ct
- 4724 Kempsville Greens Pkwy
- 4732 Kempsville Greens Pkwy
- 4707 Kempsville Greens Pkwy
- 5004 Wellston Ct
- 5005 Wynne Ct
- 435 Greenview Dr
- 334 Paxford Dr
- 4995 Century Dr
- 808 Sussex Ct
- 457 Troon Chase
- 378 Kenley Rd
- 4707 Woods Edge Rd
- 409 Troon Chase
- 816 Moffat Ln
- 4848 Kempsville Greens Pkwy Unit 202
- 4848 Kempsville Greens Pkwy Unit 204
- 4848 Kempsville Greens Pkwy Unit 406
- 4848 Kempsville Greens Pkwy Unit 206
- 4848 Kempsville Greens Pkwy Unit 404
- 4848 Kempsville Greens Pkwy Unit 105
- 4848 Kempsville Greens Pkwy Unit 305
- 4848 Kempsville Greens Pkwy Unit 103
- 4848 Kempsville Greens Pkwy Unit 405
- 4848 Kempsville Greens Pkwy Unit 304
- 4848 Kempsville Greens Pkwy Unit 204
- 4848 Kempsville Greens Pkwy Unit 202
- 4848 Kempsville Greens Pkwy Unit 203
- 4848 Kempsville Greens Pkwy Unit 205
- 4848 Kempsville Greens Pkwy Unit 403
- 4848 Kempsville Greens Pkwy Unit 206
- 4848 Kempsville Greens Pkwy Unit 406
- 4848 Kempsville Greens Pkwy Unit 404
- 4848 Kempsville Greens Pkwy Unit 402
- 4848 Kempsville Greens Pkwy Unit 401