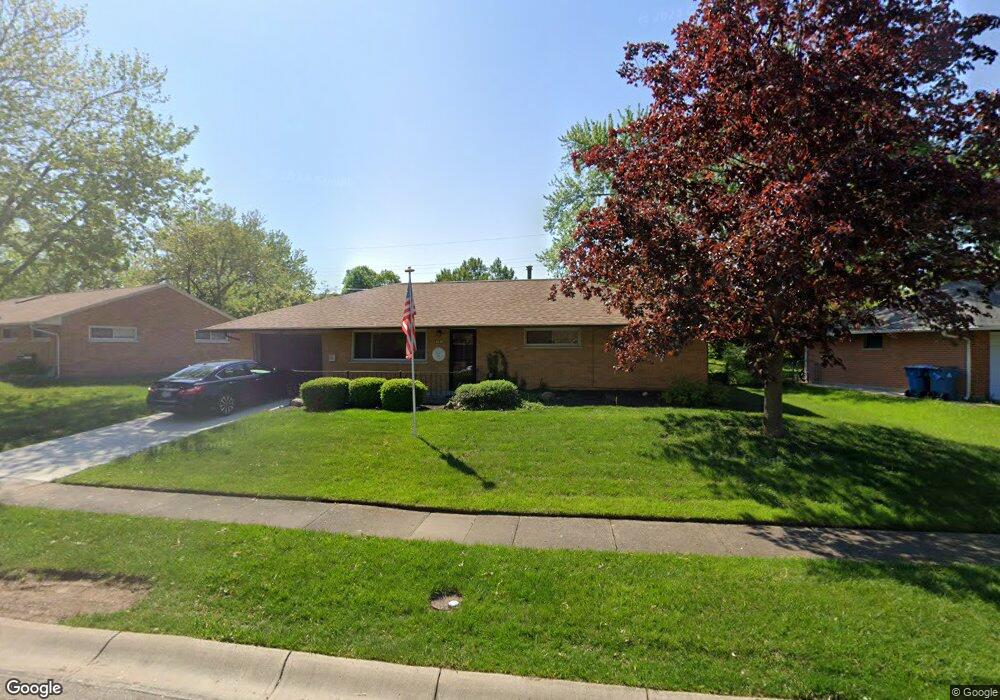
4848 Neptune Ln Dayton, OH 45424
Estimated Value: $160,000 - $199,000
3
Beds
2
Baths
1,080
Sq Ft
$167/Sq Ft
Est. Value
About This Home
This home is located at 4848 Neptune Ln, Dayton, OH 45424 and is currently estimated at $180,684, approximately $167 per square foot. 4848 Neptune Ln is a home located in Montgomery County with nearby schools including Wayne High School and Huber Heights Christian Academy.
Ownership History
Date
Name
Owned For
Owner Type
Purchase Details
Closed on
May 26, 2021
Sold by
Sheets Judy M
Bought by
Sheets Judy Marie and Judy Marie Sheets Living Trust
Current Estimated Value
Purchase Details
Closed on
Mar 18, 2021
Sold by
Humphreys Renda F
Bought by
Sheets Judy M
Purchase Details
Closed on
Jun 13, 2016
Sold by
Humphreys Farrell W
Bought by
Humphreys Farrell W and Humphreys Renda F
Purchase Details
Closed on
Jun 30, 2010
Sold by
Peralme Katherine P and Peralme Lynne
Bought by
Humphreys Farrell W
Home Financials for this Owner
Home Financials are based on the most recent Mortgage that was taken out on this home.
Original Mortgage
$79,437
Interest Rate
4.86%
Mortgage Type
VA
Purchase Details
Closed on
Dec 15, 1998
Sold by
Peralme Katherine P
Bought by
Peralme Katherine P and Goins Leslie Francis
Create a Home Valuation Report for This Property
The Home Valuation Report is an in-depth analysis detailing your home's value as well as a comparison with similar homes in the area
Home Values in the Area
Average Home Value in this Area
Purchase History
| Date | Buyer | Sale Price | Title Company |
|---|---|---|---|
| Sheets Judy Marie | -- | None Available | |
| Sheets Judy M | $136,600 | None Available | |
| Humphreys Farrell W | -- | Hallmark Title | |
| Humphreys Farrell W | $76,900 | None Available | |
| Peralme Katherine P | -- | -- |
Source: Public Records
Mortgage History
| Date | Status | Borrower | Loan Amount |
|---|---|---|---|
| Previous Owner | Humphreys Farrell W | $79,437 |
Source: Public Records
Tax History Compared to Growth
Tax History
| Year | Tax Paid | Tax Assessment Tax Assessment Total Assessment is a certain percentage of the fair market value that is determined by local assessors to be the total taxable value of land and additions on the property. | Land | Improvement |
|---|---|---|---|---|
| 2024 | $2,296 | $44,080 | $10,010 | $34,070 |
| 2023 | $2,296 | $44,080 | $10,010 | $34,070 |
| 2022 | $2,018 | $30,800 | $7,000 | $23,800 |
| 2021 | $2,068 | $30,800 | $7,000 | $23,800 |
| 2020 | $2,069 | $30,800 | $7,000 | $23,800 |
| 2019 | $1,992 | $26,190 | $7,000 | $19,190 |
| 2018 | $1,998 | $26,190 | $7,000 | $19,190 |
| 2017 | $1,985 | $26,190 | $7,000 | $19,190 |
| 2016 | $1,898 | $24,400 | $7,000 | $17,400 |
| 2015 | $1,874 | $24,400 | $7,000 | $17,400 |
| 2014 | $1,874 | $24,400 | $7,000 | $17,400 |
| 2012 | -- | $25,110 | $8,750 | $16,360 |
Source: Public Records
Map
Nearby Homes
- 5431 Naughton Dr
- 4825 Nelapark Dr
- 5455 Naughton Dr
- 4848 Rittenhouse Dr
- 4309 Kitridge Rd
- 4918 Powell Rd
- 5365 Mariner Dr
- 5669 Traymore Dr
- 5433 Pentland Cir
- 5660 Tomberg St
- 5059 Key West Dr
- 4420 Kitridge Rd
- 4608 Nowak Ave
- 5230 Monitor Dr
- 5041 Pepper Dr
- 5062 Nielson Ct
- 5952 Tibet Dr
- 4407 Nowak Ave
- 5848 Tomberg St
- 5983 Harshmanville Rd
- 4856 Neptune Ln
- 4840 Neptune Ln
- 5425 Naughton Dr
- 5419 Naughton Dr
- 4830 Neptune Ln
- 4862 Neptune Ln
- 4849 Neptune Ln
- 4843 Neptune Ln
- 4855 Neptune Ln
- 4837 Neptune Ln
- 4861 Neptune Ln
- 5437 Naughton Dr
- 4824 Neptune Ln
- 4868 Neptune Ln
- 5413 Naughton Dr
- 4867 Neptune Ln
- 4831 Neptune Ln
- 5420 Naughton Dr
- 4836 Nelapark Dr
- 4842 Nelapark Dr