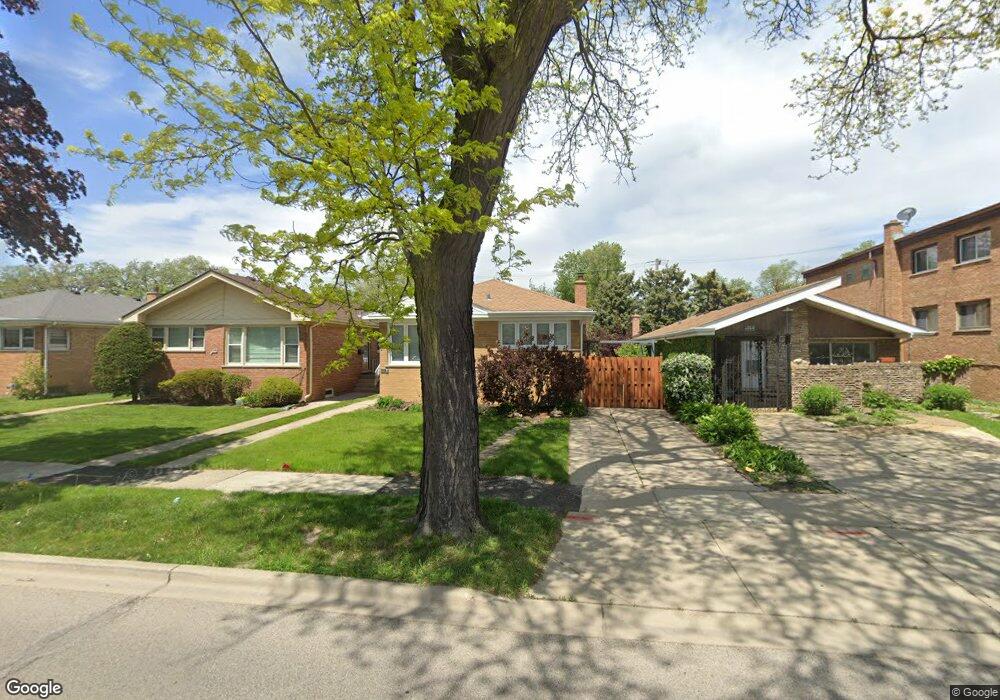
4848 Old Orchard Rd Skokie, IL 60077
Estimated Value: $337,000 - $415,064
3
Beds
1
Bath
1,025
Sq Ft
$375/Sq Ft
Est. Value
About This Home
This home is located at 4848 Old Orchard Rd, Skokie, IL 60077 and is currently estimated at $384,516, approximately $375 per square foot. 4848 Old Orchard Rd is a home located in Cook County with nearby schools including Old Orchard Jr High School, Highland Elementary School, and Niles North High School.
Ownership History
Date
Name
Owned For
Owner Type
Purchase Details
Closed on
Dec 17, 2010
Sold by
Tansley John R and Mancio Delma C
Bought by
Tansley John R and Mancio Tansley Delma C
Current Estimated Value
Home Financials for this Owner
Home Financials are based on the most recent Mortgage that was taken out on this home.
Original Mortgage
$121,000
Outstanding Balance
$2,745
Interest Rate
4.44%
Mortgage Type
New Conventional
Estimated Equity
$381,771
Purchase Details
Closed on
Nov 23, 2004
Sold by
Tansley John R
Bought by
Tansley John R and Mancio Delma C
Home Financials for this Owner
Home Financials are based on the most recent Mortgage that was taken out on this home.
Original Mortgage
$150,000
Interest Rate
5.71%
Mortgage Type
New Conventional
Purchase Details
Closed on
May 31, 1996
Sold by
Watkins David M and Watkins Janice
Bought by
Tansley John R
Home Financials for this Owner
Home Financials are based on the most recent Mortgage that was taken out on this home.
Original Mortgage
$130,000
Interest Rate
7.97%
Create a Home Valuation Report for This Property
The Home Valuation Report is an in-depth analysis detailing your home's value as well as a comparison with similar homes in the area
Home Values in the Area
Average Home Value in this Area
Purchase History
| Date | Buyer | Sale Price | Title Company |
|---|---|---|---|
| Tansley John R | -- | Lakeshore Title Agency | |
| Tansley John R | -- | Lawyers Title | |
| Tansley John R | $150,000 | -- |
Source: Public Records
Mortgage History
| Date | Status | Borrower | Loan Amount |
|---|---|---|---|
| Open | Tansley John R | $121,000 | |
| Closed | Tansley John R | $150,000 | |
| Closed | Tansley John R | $130,000 |
Source: Public Records
Tax History Compared to Growth
Tax History
| Year | Tax Paid | Tax Assessment Tax Assessment Total Assessment is a certain percentage of the fair market value that is determined by local assessors to be the total taxable value of land and additions on the property. | Land | Improvement |
|---|---|---|---|---|
| 2024 | $6,667 | $30,000 | $5,733 | $24,267 |
| 2023 | $6,463 | $30,000 | $5,733 | $24,267 |
| 2022 | $6,463 | $30,000 | $5,733 | $24,267 |
| 2021 | $5,787 | $24,474 | $4,299 | $20,175 |
| 2020 | $5,792 | $24,474 | $4,299 | $20,175 |
| 2019 | $5,855 | $27,194 | $4,299 | $22,895 |
| 2018 | $4,988 | $21,952 | $3,787 | $18,165 |
| 2017 | $5,041 | $21,952 | $3,787 | $18,165 |
| 2016 | $5,047 | $21,952 | $3,787 | $18,165 |
| 2015 | $4,529 | $18,849 | $3,276 | $15,573 |
| 2014 | $4,438 | $18,849 | $3,276 | $15,573 |
| 2013 | $4,412 | $18,849 | $3,276 | $15,573 |
Source: Public Records
Map
Nearby Homes
- 10039 Lacrosse Ave
- 10124 Peach Pkwy Unit N208
- 4710 Russett Ln Unit R1
- 10055 Frontage Rd Unit F
- 10081 Frontage Rd
- 10077 Frontage Rd Unit F
- 319 Kilpatrick Ave
- 226 Briar Dr
- 118 Lockerbie Ln
- 4901 Golf Rd Unit 310
- 407 Sunset Dr
- 414 Skokie Ct
- 9529 Bronx Ave Unit 102
- 408 Beverly Dr
- 29 Dale St
- 2536 Old Glenview Rd
- 4840 Foster St Unit 304
- 4840 Foster St Unit 303
- 4840 Foster St Unit 107
- 9725 Woods Dr Unit 1913
- 4852 Old Orchard Rd
- 4858 Old Orchard Rd
- 4858 Old Orchard Rd
- 4844 Old Orchard Rd
- 4840 Old Orchard Rd
- 4838 Old Orchard Rd
- 4838 Old Orchard Rd Unit 101
- 4838 Old Orchard Road Unit#1 Unit 1
- 10021 Lamon Ave
- 10014 La Crosse Ave
- 4900 Old Orchard Rd
- 4832 Old Orchard Rd Unit 2
- 4832 Old Orchard Rd
- 4832 Old Orchard Rd Unit 1
- 10018 La Crosse Ave
- 10025 Lamon Ave
- 4906 Old Orchard Rd
- 10024 La Crosse Ave
- 10014 Lamon Ave
- 10029 Lamon Ave