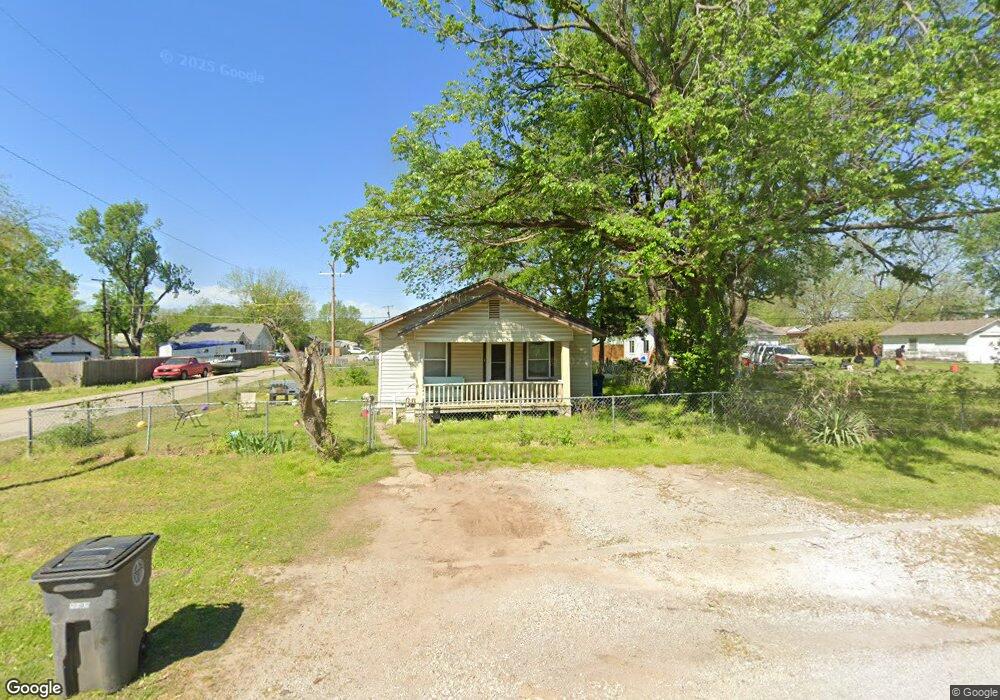
4848 S 29th West Ave Tulsa, OK 74107
Red Fork NeighborhoodEstimated Value: $136,092 - $151,000
3
Beds
2
Baths
1,122
Sq Ft
$128/Sq Ft
Est. Value
About This Home
This home is located at 4848 S 29th West Ave, Tulsa, OK 74107 and is currently estimated at $143,773, approximately $128 per square foot. 4848 S 29th West Ave is a home located in Tulsa County with nearby schools including Robertson Elementary School, Daniel Webster High School, and St Catherine School.
Ownership History
Date
Name
Owned For
Owner Type
Purchase Details
Closed on
Jul 25, 2008
Sold by
Whitehead Allan
Bought by
Whitehead Virginia
Current Estimated Value
Purchase Details
Closed on
Aug 22, 2003
Sold by
Brooks T J and Brooks Tara
Bought by
Whitehead Allan D and Whitehead Virginia C
Home Financials for this Owner
Home Financials are based on the most recent Mortgage that was taken out on this home.
Original Mortgage
$54,000
Outstanding Balance
$23,534
Interest Rate
5.71%
Mortgage Type
Purchase Money Mortgage
Estimated Equity
$120,239
Purchase Details
Closed on
Jun 29, 2001
Sold by
J D & B Investment Properties Inc
Bought by
Brooks T J
Purchase Details
Closed on
Dec 28, 2000
Sold by
Hoover Gerald J
Bought by
Jd & B Investment Properties Inc
Create a Home Valuation Report for This Property
The Home Valuation Report is an in-depth analysis detailing your home's value as well as a comparison with similar homes in the area
Home Values in the Area
Average Home Value in this Area
Purchase History
| Date | Buyer | Sale Price | Title Company |
|---|---|---|---|
| Whitehead Virginia | -- | None Available | |
| Whitehead Allan D | $72,000 | -- | |
| Brooks T J | $68,000 | First Amer Title & Abstract | |
| Jd & B Investment Properties Inc | $25,000 | -- |
Source: Public Records
Mortgage History
| Date | Status | Borrower | Loan Amount |
|---|---|---|---|
| Open | Whitehead Allan D | $54,000 |
Source: Public Records
Tax History Compared to Growth
Tax History
| Year | Tax Paid | Tax Assessment Tax Assessment Total Assessment is a certain percentage of the fair market value that is determined by local assessors to be the total taxable value of land and additions on the property. | Land | Improvement |
|---|---|---|---|---|
| 2025 | $1,130 | $8,430 | $1,321 | $7,109 |
| 2024 | $1,001 | $8,156 | $1,359 | $6,797 |
| 2023 | $1,001 | $8,888 | $1,481 | $7,407 |
| 2022 | $1,017 | $7,630 | $1,526 | $6,104 |
| 2021 | $975 | $7,379 | $1,476 | $5,903 |
| 2020 | $961 | $7,379 | $1,476 | $5,903 |
| 2019 | $1,011 | $7,379 | $1,476 | $5,903 |
| 2018 | $983 | $7,158 | $1,432 | $5,726 |
| 2017 | $949 | $7,920 | $1,584 | $6,336 |
| 2016 | $929 | $7,920 | $1,584 | $6,336 |
| 2015 | $931 | $7,920 | $1,584 | $6,336 |
| 2014 | $922 | $7,920 | $1,584 | $6,336 |
Source: Public Records
Map
Nearby Homes
- 5035 S 31st West Ave
- 4823 S 27th Ave W
- 5023 S 27th West Ave
- 4727 S 33rd West Ave
- 4718 S 25th West Ave
- 2312 W 47th Place
- 2317 W 47th Place
- 4532 S 28th West Ave
- 5032 S 36th West Ave
- 4844 S 34th Ave W
- 2114 W 48th St
- 4529 E 24th West Ave
- 5353 S 33rd West Ave
- 2114 W 45th Place
- 2022 W 43rd St
- 1905 W 49th St
- 4245 S 28th West Ave
- 1908 W 47th Place
- 4532 S Xenophon Ave
- 1901 W 46th St
- 4840 S 29th West Ave
- 5002 S 29th West Ave
- 4849 S 30th West Ave
- 4836 S 29th West Ave
- 4843 S 30th West Ave
- 5006 S 29th West Ave
- 4839 S 30th West Ave
- 5003 S 30th West Ave
- 4834 S 29th West Ave
- 4839 S 30th Ave W
- 4837 S 30th West Ave
- 4847 S 29th West Ave
- 5010 S 29th West Ave
- 5007 S 30th West Ave
- 4843 S 29th West Ave
- 4831 S 30th Ave W
- 4839 S 29th West Ave
- 5001 S 29th West Ave
- 4831 S 30th West Ave
- 4830 S 29th West Ave