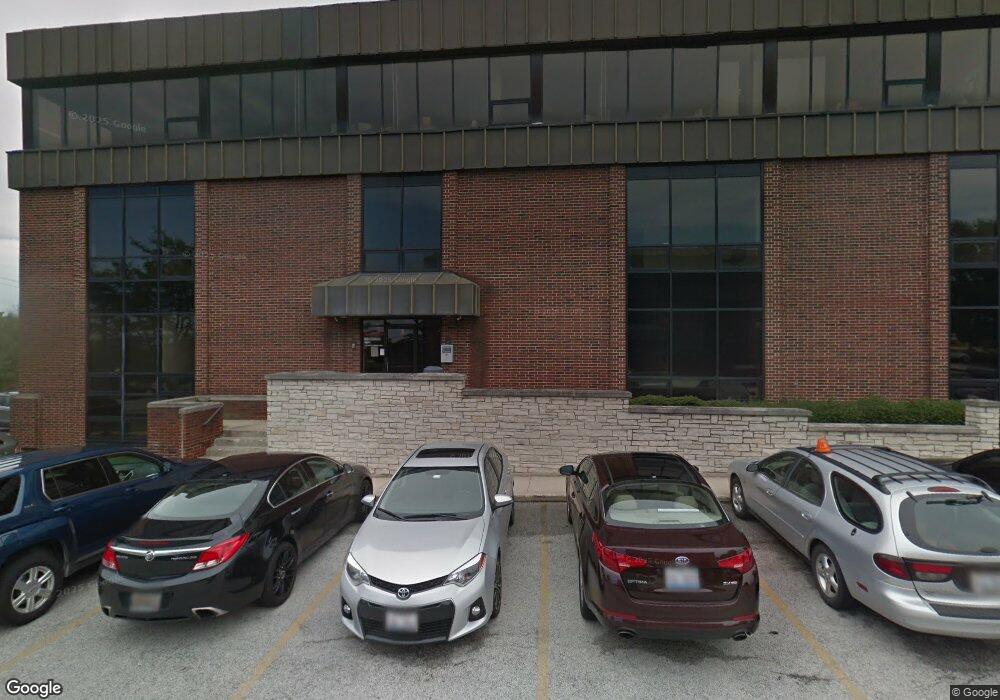
4849 167th St Unit 1 Oak Forest, IL 60452
Estimated Value: $890,841
--
Bed
--
Bath
--
Sq Ft
1.34
Acres
About This Home
This home is located at 4849 167th St Unit 1, Oak Forest, IL 60452 and is currently estimated at $890,841. 4849 167th St Unit 1 is a home located in Cook County with nearby schools including Kimberly Heights Elementary School, Scarlet Oak Elementary School, and Arbor Park Middle School.
Ownership History
Date
Name
Owned For
Owner Type
Purchase Details
Closed on
Oct 16, 2013
Sold by
Pb Sw Commercial Llc
Bought by
Mrc Holdings Llc
Current Estimated Value
Home Financials for this Owner
Home Financials are based on the most recent Mortgage that was taken out on this home.
Original Mortgage
$360,000
Interest Rate
5.5%
Mortgage Type
Commercial
Purchase Details
Closed on
Mar 28, 2013
Sold by
Cloister Development Co
Bought by
Pb Sw Commercial Llc
Purchase Details
Closed on
Feb 8, 2013
Sold by
Malley Daniel O
Bought by
Daley Richard J
Purchase Details
Closed on
Dec 13, 2011
Sold by
Cloister Development Co
Bought by
The Privatebank & Trust Company
Purchase Details
Closed on
Feb 19, 2004
Sold by
Palos Bank & Trust Co
Bought by
Cloister Development Co
Home Financials for this Owner
Home Financials are based on the most recent Mortgage that was taken out on this home.
Original Mortgage
$2,250,000
Interest Rate
5.95%
Mortgage Type
Commercial
Create a Home Valuation Report for This Property
The Home Valuation Report is an in-depth analysis detailing your home's value as well as a comparison with similar homes in the area
Home Values in the Area
Average Home Value in this Area
Purchase History
| Date | Buyer | Sale Price | Title Company |
|---|---|---|---|
| Mrc Holdings Llc | $480,000 | Fidelity National Title | |
| Pb Sw Commercial Llc | -- | None Available | |
| Daley Richard J | $258,583 | None Available | |
| The Privatebank & Trust Company | $330,591 | None Available | |
| Cloister Development Co | -- | -- |
Source: Public Records
Mortgage History
| Date | Status | Borrower | Loan Amount |
|---|---|---|---|
| Closed | Mrc Holdings Llc | $360,000 | |
| Previous Owner | Cloister Development Co | $2,250,000 |
Source: Public Records
Tax History Compared to Growth
Tax History
| Year | Tax Paid | Tax Assessment Tax Assessment Total Assessment is a certain percentage of the fair market value that is determined by local assessors to be the total taxable value of land and additions on the property. | Land | Improvement |
|---|---|---|---|---|
| 2024 | $80,163 | $198,650 | $104,968 | $93,682 |
| 2023 | $83,454 | $221,656 | $104,968 | $116,688 |
| 2022 | $83,454 | $179,153 | $83,975 | $95,178 |
| 2021 | $72,746 | $160,114 | $83,974 | $76,140 |
| 2020 | $70,084 | $160,000 | $83,974 | $76,026 |
| 2019 | $54,827 | $122,188 | $76,976 | $45,212 |
| 2018 | $46,054 | $104,944 | $76,976 | $27,968 |
| 2017 | $54,205 | $124,089 | $76,976 | $47,113 |
| 2016 | $66,534 | $146,622 | $62,980 | $83,642 |
| 2015 | $69,101 | $156,750 | $62,980 | $93,770 |
| 2014 | $57,051 | $132,702 | $62,980 | $69,722 |
| 2013 | $49,248 | $128,578 | $62,980 | $65,598 |
Source: Public Records
Map
Nearby Homes
- 16740 Forest Ave
- 5112 Deerpath Rd Unit 4
- 16934 Cicero Ave
- 16938 Cicero Ave
- 5103 Elmwood Rd
- 5185 Greentree Rd
- 5256 169th Place
- 16465 Roy St
- 4401 Adele Ln
- 16453 Harold St
- 16224 S Cicero Ave
- 16524 Brockton Ln
- 5048 171st St
- 5125 171st St
- 16409 Craig Dr
- 4348 Mann St
- 4363 Henry St
- 16104 Oak Ave
- 17213 Arrowhead Trace
- 4316 Mann St
- 4849 167th St
- 16733 Forest Ave
- 16733 Forest Ave Unit 1S
- 16733 Forest Ave Unit 2S
- 16733 Forest Ave Unit 3-N
- 16731 Forest Ave Unit 1N
- 16731 Forest Ave
- 16716 Forest Ave
- 16722 Forest Ave
- 16728 Forest Ave
- 4838 Kimberly Ct
- 16732 Forest Ave
- 4842 Kimberly Ct
- 4834 Kimberly Ct
- 4846 Kimberly Ct
- 4910 Forest Ct
- 4829 Kimberly Ct
- 4914 Forest Ct
- 16744 Forest Ave
- 4918 Forest Ct