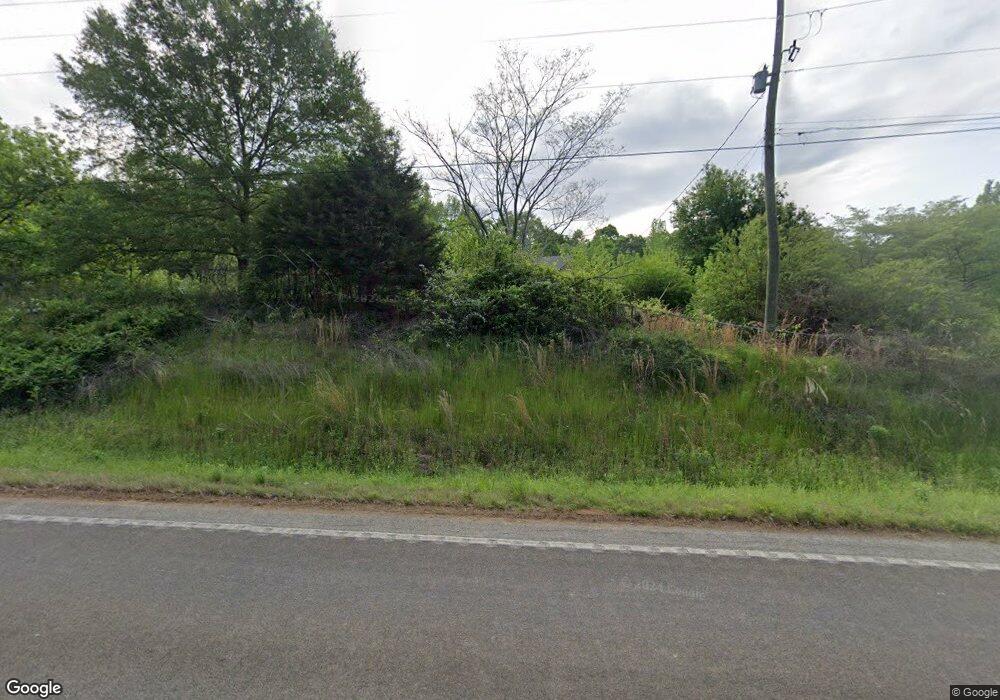
4849 Fosters Mill Rd SW Cave Spring, GA 30124
Estimated Value: $285,000 - $296,000
--
Bed
1
Bath
1,752
Sq Ft
$167/Sq Ft
Est. Value
About This Home
This home is located at 4849 Fosters Mill Rd SW, Cave Spring, GA 30124 and is currently estimated at $292,092, approximately $166 per square foot. 4849 Fosters Mill Rd SW is a home located in Floyd County with nearby schools including Coosa Middle School and Coosa High School.
Ownership History
Date
Name
Owned For
Owner Type
Purchase Details
Closed on
Sep 22, 2020
Sold by
Mccord Jason H
Bought by
Sharpe Bradley Marc
Current Estimated Value
Purchase Details
Closed on
Jul 28, 2015
Sold by
Mccord Mary A
Bought by
Mccord Jason H
Purchase Details
Closed on
Jun 7, 2002
Sold by
Mccord Mary A
Bought by
Mccord Mary A
Purchase Details
Closed on
Aug 6, 2001
Sold by
Mccord Harvey
Bought by
Mccord Mary A
Purchase Details
Closed on
Apr 20, 1989
Sold by
Mccord Harvey and Mary Alice
Bought by
Mccord Harvey
Purchase Details
Closed on
Dec 22, 1971
Sold by
Hamilton Theodore
Bought by
Mccord Harvey and Mary Alice
Purchase Details
Closed on
Aug 29, 1966
Sold by
Hanson Gordon and Hanson Cleo
Bought by
Hamilton Theodore
Purchase Details
Closed on
Jan 1, 1961
Bought by
Hanson Gordon and Hanson Cleo
Create a Home Valuation Report for This Property
The Home Valuation Report is an in-depth analysis detailing your home's value as well as a comparison with similar homes in the area
Home Values in the Area
Average Home Value in this Area
Purchase History
| Date | Buyer | Sale Price | Title Company |
|---|---|---|---|
| Sharpe Bradley Marc | -- | -- | |
| Mccord Jason H | -- | -- | |
| Mccord Mary A | -- | -- | |
| Mccord Mary A | -- | -- | |
| Mccord Harvey | -- | -- | |
| Mccord Harvey | $25,000 | -- | |
| Hamilton Theodore | $15,500 | -- | |
| Hanson Gordon | -- | -- |
Source: Public Records
Tax History Compared to Growth
Tax History
| Year | Tax Paid | Tax Assessment Tax Assessment Total Assessment is a certain percentage of the fair market value that is determined by local assessors to be the total taxable value of land and additions on the property. | Land | Improvement |
|---|---|---|---|---|
| 2024 | $1,940 | $92,001 | $22,439 | $69,562 |
| 2023 | $1,750 | $79,511 | $20,399 | $59,112 |
| 2022 | $1,398 | $57,710 | $16,960 | $40,750 |
| 2021 | $1,243 | $48,280 | $15,370 | $32,910 |
| 2020 | $1,246 | $45,867 | $14,889 | $30,978 |
| 2019 | $1,196 | $43,935 | $14,889 | $29,046 |
| 2018 | $1,151 | $41,429 | $14,183 | $27,246 |
| 2017 | $1,183 | $39,239 | $13,132 | $26,107 |
| 2016 | $1,111 | $36,405 | $13,120 | $23,285 |
| 2015 | -- | $36,405 | $13,120 | $23,285 |
| 2014 | -- | $36,405 | $13,120 | $23,285 |
Source: Public Records
Map
Nearby Homes
- 0 Melson Rd SW Unit 7676052
- 0 Melson Rd SW Unit 10636997
- 5598 Fosters Mill Rd
- 0 Mill Rd Unit 10629874
- 0 Mill Rd Unit 7670319
- 5677 Fosters Mill Rd SW
- 57 Mill St
- 104 Fincher St
- 22 River St SW
- 8876 Cave Spring Rd SW
- 7 Herschel Mize Dr SW
- 7 Herschel Mize Dr
- 8876 Cave Spring
- 907 Gadsden Rd SW
- 10 Ridge Rd SW
- 0 McGee Bend Rd SW Unit 10351960
- 2053 Buttermilk Rd SW
- 8006 Blacks Bluff Rd SW
- 0 George Rd SW Unit 10567389
- 0 George Rd SW Unit 7618177
- 4775 Fosters Mill Rd SW
- 4761 Fosters Mill Rd SW
- 4765 Fosters Mill Rd SW
- 4860 Fosters Mill Rd SW
- 4965 Fosters Mill Rd SW
- 114 Melson Rd SW
- 58 Melson Rd SW
- 4783 Fosters Mill Rd SW
- 111 Melson Rd SW
- 4761 Fosters Mill Rd
- 0 Melson Rd SW Unit 7328755
- 0 Melson Rd SW Unit 7473593
- 0 Melson Rd SW Unit 7401834
- 0 Melson Rd SW Unit 2640736
- 0 Melson Rd SW Unit 7382918
- 0 Melson Rd SW Unit 8277661
- 0 Melson Rd SW Unit 8826058
- 0 Melson Rd SW Unit 5924840
- 5109 Fosters Mill Rd SW
- 5053 Fosters Mill Rd SW