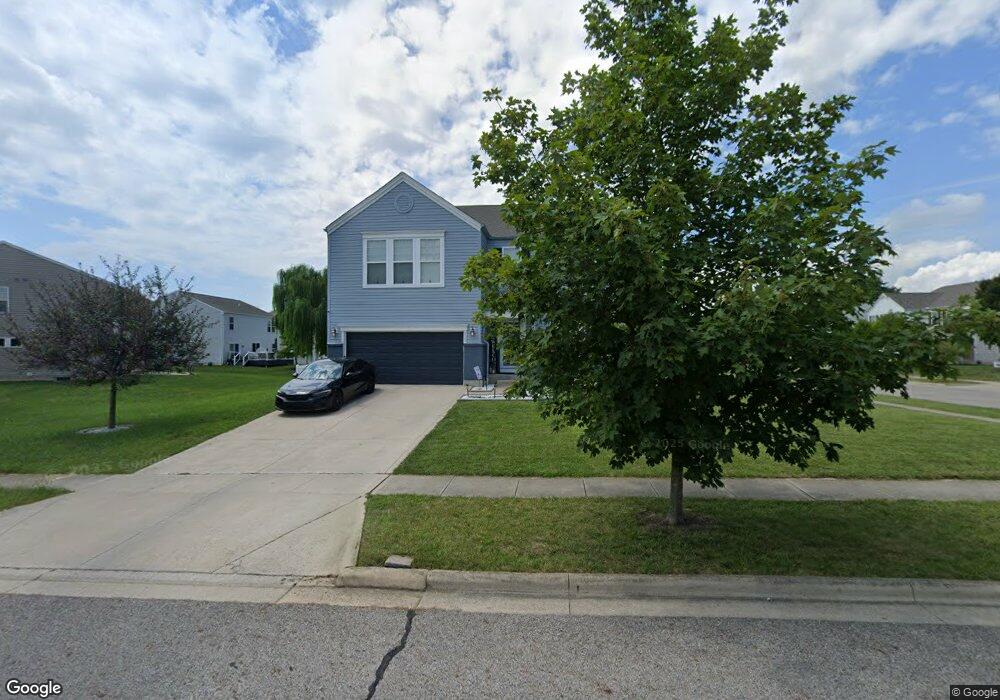
4849 Shallowford Loop Unit 165 Grove City, OH 43123
Estimated Value: $454,000 - $492,000
4
Beds
3
Baths
3,120
Sq Ft
$153/Sq Ft
Est. Value
About This Home
This home is located at 4849 Shallowford Loop Unit 165, Grove City, OH 43123 and is currently estimated at $476,785, approximately $152 per square foot. 4849 Shallowford Loop Unit 165 is a home located in Franklin County with nearby schools including Hayes Intermediate School, Jc Sommer Elementary School, and Jackson Middle School.
Ownership History
Date
Name
Owned For
Owner Type
Purchase Details
Closed on
Jun 30, 2021
Sold by
Wolfe Jason and Wolfe Molly
Bought by
Daniels Carl L and Daniels Tina
Current Estimated Value
Home Financials for this Owner
Home Financials are based on the most recent Mortgage that was taken out on this home.
Original Mortgage
$304,000
Outstanding Balance
$275,959
Interest Rate
2.93%
Mortgage Type
New Conventional
Estimated Equity
$200,826
Purchase Details
Closed on
Jun 9, 2009
Sold by
Fischer Single Family Homes Ii Llc
Bought by
Wolfe Jason and Wolfe Molly
Purchase Details
Closed on
Aug 28, 2008
Sold by
Grand Communities Ltd
Bought by
Fischer Single Family Homes Ii Llc
Purchase Details
Closed on
Aug 27, 2008
Sold by
Klekamp Jody T
Bought by
Grand Communities Ltd
Purchase Details
Closed on
Aug 18, 2008
Sold by
Grand Communities Ltd
Bought by
Klekamp Jody T
Create a Home Valuation Report for This Property
The Home Valuation Report is an in-depth analysis detailing your home's value as well as a comparison with similar homes in the area
Home Values in the Area
Average Home Value in this Area
Purchase History
| Date | Buyer | Sale Price | Title Company |
|---|---|---|---|
| Daniels Carl L | $380,000 | Title Connect | |
| Wolfe Jason | $208,000 | Homestead | |
| Fischer Single Family Homes Ii Llc | $36,500 | Attorney | |
| Grand Communities Ltd | -- | Attorney | |
| Klekamp Jody T | -- | Attorney |
Source: Public Records
Mortgage History
| Date | Status | Borrower | Loan Amount |
|---|---|---|---|
| Open | Daniels Carl L | $304,000 |
Source: Public Records
Tax History Compared to Growth
Tax History
| Year | Tax Paid | Tax Assessment Tax Assessment Total Assessment is a certain percentage of the fair market value that is determined by local assessors to be the total taxable value of land and additions on the property. | Land | Improvement |
|---|---|---|---|---|
| 2024 | $5,867 | $129,020 | $37,910 | $91,110 |
| 2023 | $5,784 | $129,010 | $37,905 | $91,105 |
| 2022 | $6,749 | $110,670 | $21,630 | $89,040 |
| 2021 | $6,879 | $110,670 | $21,630 | $89,040 |
| 2020 | $6,955 | $110,670 | $21,630 | $89,040 |
| 2019 | $6,130 | $91,780 | $18,030 | $73,750 |
| 2018 | $5,742 | $91,780 | $18,030 | $73,750 |
| 2017 | $6,084 | $91,780 | $18,030 | $73,750 |
| 2016 | $5,376 | $74,170 | $13,690 | $60,480 |
| 2015 | $5,377 | $74,170 | $13,690 | $60,480 |
| 2014 | $5,381 | $74,170 | $13,690 | $60,480 |
| 2013 | $2,418 | $70,630 | $13,020 | $57,610 |
Source: Public Records
Map
Nearby Homes
- 3300 Belgreen Dr
- 4922 Wind Crest Ln
- Newport Plan at Holton Run - Woodside at Holton Run
- Cambridge Plan at Holton Run - Woodside at Holton Run
- 3234 Callie Marie Dr
- 4208 Mayfair Ct N
- 4793 Woodside Dr Unit 56
- Edgewood Plan at Holton Run
- Palmetto Plan at Holton Run
- Galveston Plan at Holton Run
- Manchester Plan at Holton Run
- McKenzie Plan at Holton Run
- Sanibel Plan at Holton Run
- Augustine Plan at Holton Run
- Brookhaven Plan at Holton Run
- Bradenton Plan at Holton Run
- Biscayne Plan at Holton Run
- Lauderdale Plan at Holton Run
- 5170 Bradstone Loop
- 3575 Artberry Way Unit 42
- 4849 Shallowford Loop
- 3320 Belgreen Dr
- 3320 Belgreen Dr Unit 162
- 3337 Belgreen Dr Unit 172
- 3337 Belgreen Dr
- 4854 Shallowford Loop Unit 142
- 4854 Shallowford Loop
- 3330 Belgreen Dr Unit 161
- 4879 Shallowford Loop
- 3310 Belgreen Dr
- 3310 Belgreen Dr Unit 163
- 4864 Shallowford Loop
- 4909 Shallowford Loop Unit 167
- 3340 Belgreen Dr
- 3340 Belgreen Dr Unit 160
- 0 Shallowford Lp Loop
- 3349 Belgreen Dr Unit 171
- 3349 Belgreen Dr
- 4874 Shallowford Loop
- 4874 Shallowford Loop Unit 144