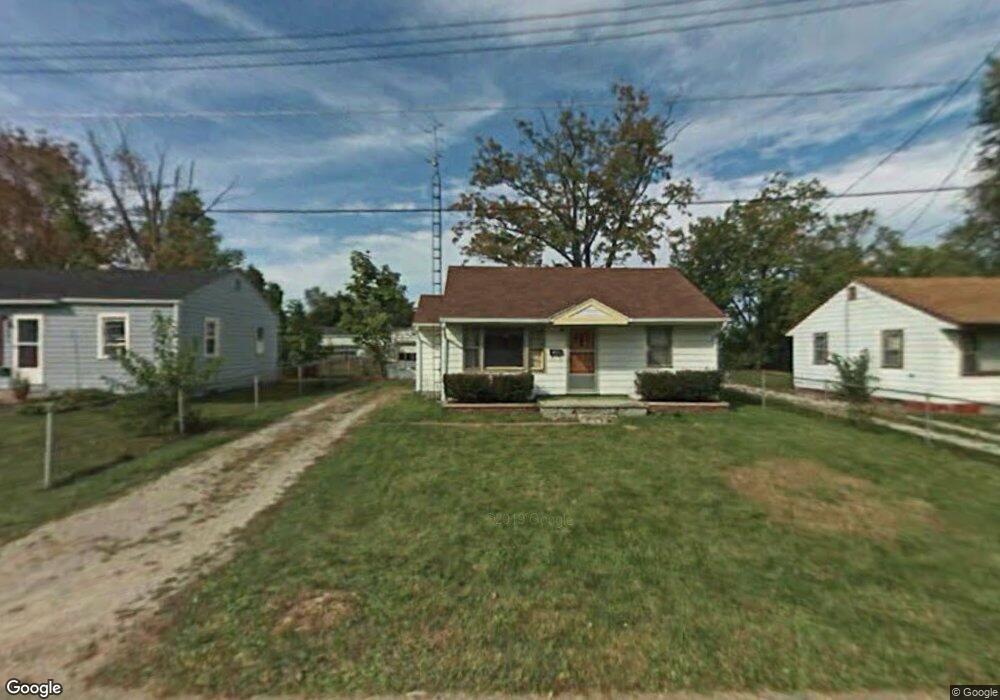
485 Collins Dr Mansfield, OH 44903
Estimated Value: $66,000 - $79,000
2
Beds
1
Bath
720
Sq Ft
$99/Sq Ft
Est. Value
About This Home
This home is located at 485 Collins Dr, Mansfield, OH 44903 and is currently estimated at $71,476, approximately $99 per square foot. 485 Collins Dr is a home located in Richland County with nearby schools including Foundation Academy, Mansfield Elective Academy, and Goal Digital Academy.
Ownership History
Date
Name
Owned For
Owner Type
Purchase Details
Closed on
Jan 18, 2019
Sold by
Sps Properties Of Mansfield Llc
Bought by
Noble Carl W
Current Estimated Value
Purchase Details
Closed on
Nov 27, 2012
Sold by
Merwine Larry D and Merwine Larry
Bought by
Sps Properties Of Mansfield Llc
Purchase Details
Closed on
May 14, 2010
Sold by
Gray Frank and Gray Carole
Bought by
Merwine Larry D
Purchase Details
Closed on
Aug 13, 2008
Sold by
Hsbc Bank Usa Na
Bought by
Gray Frank
Purchase Details
Closed on
Apr 10, 2008
Sold by
Leahy Kimberly
Bought by
Hsbc Bank Usa Na and Registered Holders For Ace Securities Co
Purchase Details
Closed on
Jul 16, 1998
Sold by
Schoonyan John A
Bought by
Leahy Kimberly
Home Financials for this Owner
Home Financials are based on the most recent Mortgage that was taken out on this home.
Original Mortgage
$28,350
Interest Rate
7.15%
Mortgage Type
New Conventional
Create a Home Valuation Report for This Property
The Home Valuation Report is an in-depth analysis detailing your home's value as well as a comparison with similar homes in the area
Home Values in the Area
Average Home Value in this Area
Purchase History
| Date | Buyer | Sale Price | Title Company |
|---|---|---|---|
| Noble Carl W | $33,000 | Hawkins Title Research File | |
| Sps Properties Of Mansfield Llc | -- | Southern Title | |
| Merwine Larry D | $20,000 | Southern Title | |
| Gray Frank | $13,300 | Evans Title Agency Inc | |
| Hsbc Bank Usa Na | $14,000 | None Available | |
| Leahy Kimberly | $31,500 | -- |
Source: Public Records
Mortgage History
| Date | Status | Borrower | Loan Amount |
|---|---|---|---|
| Previous Owner | Leahy Kimberly | $28,350 |
Source: Public Records
Tax History
| Year | Tax Paid | Tax Assessment Tax Assessment Total Assessment is a certain percentage of the fair market value that is determined by local assessors to be the total taxable value of land and additions on the property. | Land | Improvement |
|---|---|---|---|---|
| 2024 | $633 | $13,830 | $1,690 | $12,140 |
| 2023 | $648 | $13,830 | $1,690 | $12,140 |
| 2022 | $546 | $9,770 | $1,530 | $8,240 |
| 2021 | $550 | $9,770 | $1,530 | $8,240 |
| 2020 | $562 | $9,770 | $1,530 | $8,240 |
| 2019 | $637 | $9,770 | $1,530 | $8,240 |
| 2018 | $622 | $9,660 | $1,420 | $8,240 |
| 2017 | $649 | $9,660 | $1,420 | $8,240 |
| 2016 | $692 | $10,720 | $2,250 | $8,470 |
| 2015 | $661 | $10,720 | $2,250 | $8,470 |
| 2014 | $652 | $10,720 | $2,250 | $8,470 |
| 2012 | $263 | $11,280 | $2,370 | $8,910 |
Source: Public Records
Map
Nearby Homes
- 688 Mcpherson St
- 0 State Route 314 Unit 9069650
- 492 Stark St
- 572 France St
- 480 Mcpherson St
- 641 Averill Ave
- 739 Armstrong St
- 0 Highway 30
- 701 Springmill St
- 230 Rae Ave
- 212 Penn Ave
- 0 Voegele Ave Unit Lot 6048, 6049, 6
- 362-364 W 6th St
- 368 W 6th St
- 340 Boston Ave
- 891 Springmill Rd
- 728 N Trimble Rd
- 0 W Fourth St - Trimble Lenox
- 81 Penn Ave
- 878 Fairfax Ave
Your Personal Tour Guide
Ask me questions while you tour the home.