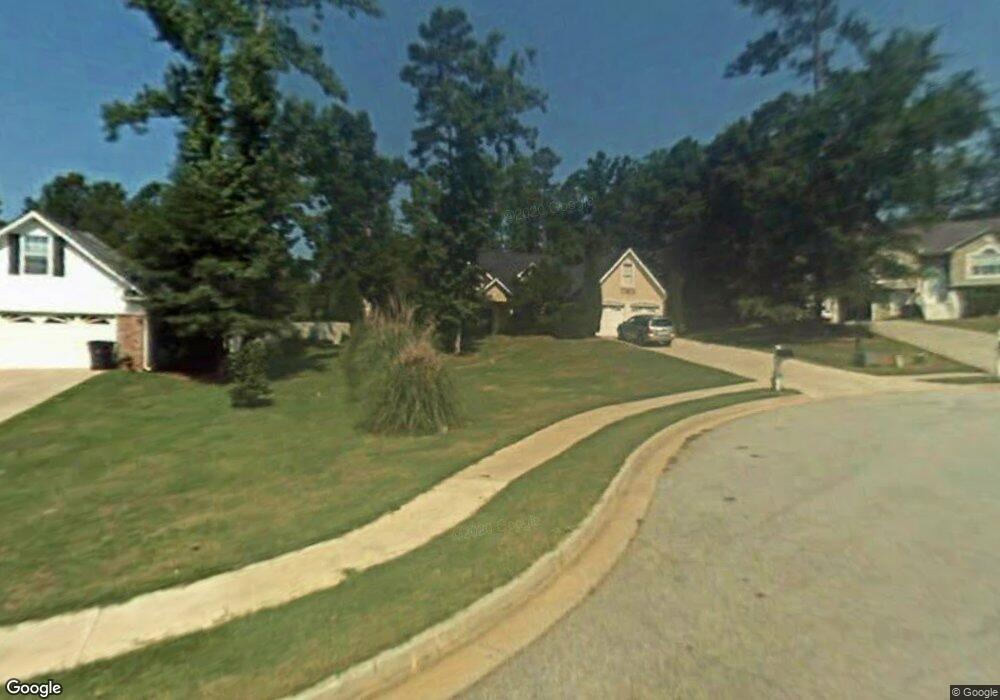
485 Crosshaven Way McDonough, GA 30253
Estimated Value: $293,569 - $315,000
4
Beds
2
Baths
1,889
Sq Ft
$162/Sq Ft
Est. Value
About This Home
This home is located at 485 Crosshaven Way, McDonough, GA 30253 and is currently estimated at $306,892, approximately $162 per square foot. 485 Crosshaven Way is a home located in Henry County with nearby schools including Union Grove Middle School, Union Grove High School, and Hickory Flat Elementary School.
Ownership History
Date
Name
Owned For
Owner Type
Purchase Details
Closed on
Jun 9, 2011
Sold by
Sargent Sabrina
Bought by
Whitley Frances P
Current Estimated Value
Purchase Details
Closed on
Apr 12, 2011
Sold by
Wells Fargo Bk Na
Bought by
Sargent Sabrina
Purchase Details
Closed on
Dec 7, 2010
Sold by
White Christopher J
Bought by
Wells Fargo Bk Na
Purchase Details
Closed on
Apr 18, 2002
Sold by
Mullen David J
Bought by
White Christopher J
Home Financials for this Owner
Home Financials are based on the most recent Mortgage that was taken out on this home.
Original Mortgage
$148,724
Interest Rate
7.07%
Mortgage Type
New Conventional
Purchase Details
Closed on
Apr 30, 1997
Sold by
M N W Constr Co
Bought by
Mullen David J
Home Financials for this Owner
Home Financials are based on the most recent Mortgage that was taken out on this home.
Original Mortgage
$114,980
Interest Rate
8.2%
Mortgage Type
FHA
Create a Home Valuation Report for This Property
The Home Valuation Report is an in-depth analysis detailing your home's value as well as a comparison with similar homes in the area
Home Values in the Area
Average Home Value in this Area
Purchase History
| Date | Buyer | Sale Price | Title Company |
|---|---|---|---|
| Whitley Frances P | $115,900 | -- | |
| Sargent Sabrina | $67,900 | -- | |
| Wells Fargo Bk Na | $64,337 | -- | |
| White Christopher J | $149,900 | -- | |
| Mullen David J | $117,700 | -- |
Source: Public Records
Mortgage History
| Date | Status | Borrower | Loan Amount |
|---|---|---|---|
| Previous Owner | White Christopher J | $148,724 | |
| Previous Owner | Mullen David J | $114,980 |
Source: Public Records
Tax History Compared to Growth
Tax History
| Year | Tax Paid | Tax Assessment Tax Assessment Total Assessment is a certain percentage of the fair market value that is determined by local assessors to be the total taxable value of land and additions on the property. | Land | Improvement |
|---|---|---|---|---|
| 2025 | $563 | $125,960 | $16,000 | $109,960 |
| 2024 | $563 | $120,880 | $16,000 | $104,880 |
| 2023 | $336 | $121,080 | $14,000 | $107,080 |
| 2022 | $481 | $90,600 | $14,000 | $76,600 |
| 2021 | $481 | $77,960 | $14,000 | $63,960 |
| 2020 | $481 | $70,800 | $12,000 | $58,800 |
| 2019 | $481 | $66,400 | $10,000 | $56,400 |
| 2018 | $0 | $62,880 | $10,000 | $52,880 |
| 2016 | $481 | $54,360 | $8,000 | $46,360 |
| 2015 | $512 | $51,280 | $8,000 | $43,280 |
| 2014 | -- | $51,840 | $8,000 | $43,840 |
Source: Public Records
Map
Nearby Homes
- 479 Crosshaven Way
- 1008 Carlyle Place
- 733 Stonehaven Chase
- 1150 Strath Clyde Way
- 212 Himalaya Way
- 248 Cranapple Ln
- 146 Himalaya Way
- 236 Himalaya Way
- 1125 Strath Clyde Way
- 401 Crosshaven Way
- 152 Rockport Dr
- 153 Rockport Dr
- 0 E Lake Pkwy Unit 9004730
- 1181 Paramount Dr
- 176 Cranapple Ln
- 235 Springdale Rd
- 796 Rock Ln
- 209 Brannans Walk
- 221 Summit View Dr
- 248 Brannans Walk
- 495 Crosshaven Way
- 806 Clifton Ridge
- 812 Clifton Ridge
- 498 Crosshaven Way
- 800 Clifton Ridge Unit 110
- 800 Clifton Ridge
- 820 Clifton Ridge
- 820 Clifton Ridge Unit 113
- 473 Crosshaven Way
- 494 Crosshaven Way
- 834 Clifton Ridge
- 484 Crosshaven Way
- 490 Crosshaven Way
- 478 Crosshaven Way
- 842 Clifton Ridge
- 472 Crosshaven Way Unit 126
- 850 Clifton Ridge
- 813 Clifton Ridge
- 807 Clifton Ridge Unit 807
- 807 Clifton Ridge