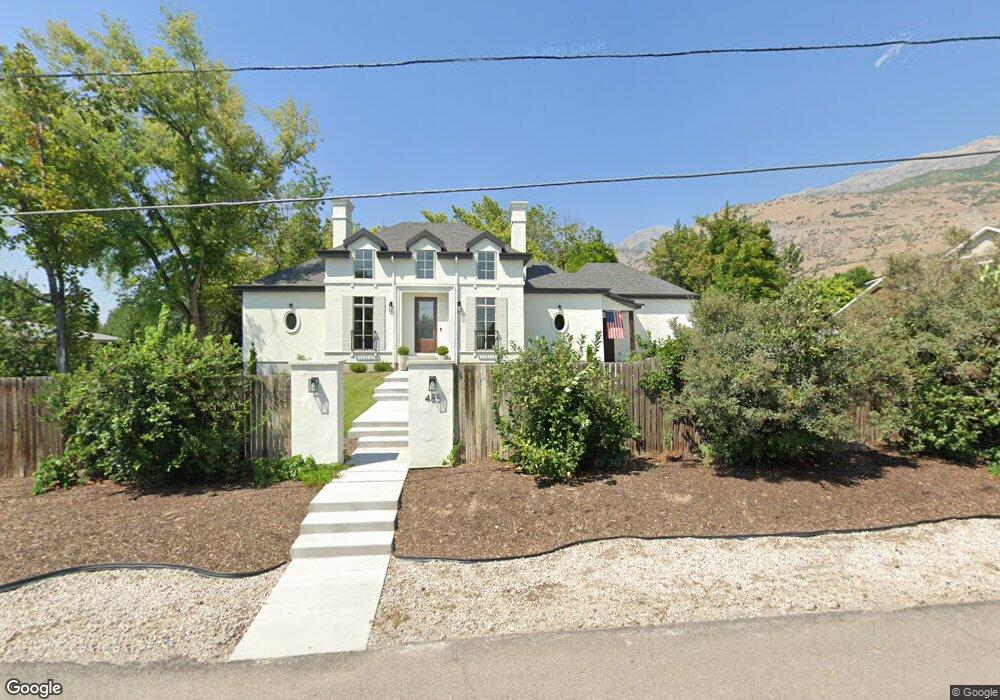
485 E 400 N Unit .53 Lindon, UT 84042
Estimated Value: $815,000 - $1,125,146
1
Bed
3
Baths
1,789
Sq Ft
$520/Sq Ft
Est. Value
About This Home
This home is located at 485 E 400 N Unit .53, Lindon, UT 84042 and is currently estimated at $930,715, approximately $520 per square foot. 485 E 400 N Unit .53 is a home located in Utah County with nearby schools including Lindon Elementary School, Oak Canyon Junior High School, and Pleasant Grove High School.
Ownership History
Date
Name
Owned For
Owner Type
Purchase Details
Closed on
Jun 24, 2019
Sold by
Germane Geoffrey J and Germane Sydney L
Bought by
Morrill Michael S and Morrill Jeneil
Current Estimated Value
Home Financials for this Owner
Home Financials are based on the most recent Mortgage that was taken out on this home.
Original Mortgage
$120,000
Interest Rate
4%
Mortgage Type
New Conventional
Purchase Details
Closed on
Jun 15, 2018
Sold by
Chesnut Bruce W and Chesnut Tamara
Bought by
Germance Geoffrey J and Germance Sydney L
Purchase Details
Closed on
May 21, 2015
Sold by
Haws Thomas James and Haws Vicki Heen
Bought by
Chesnut Bruce W and Chesnut Tamara
Create a Home Valuation Report for This Property
The Home Valuation Report is an in-depth analysis detailing your home's value as well as a comparison with similar homes in the area
Home Values in the Area
Average Home Value in this Area
Purchase History
| Date | Buyer | Sale Price | Title Company |
|---|---|---|---|
| Morrill Michael S | -- | Bartlett Title Ins Agcy Inc | |
| Germance Geoffrey J | -- | Bartlett Title Ins Agency | |
| Chesnut Bruce W | -- | Backman Title Services Ltd |
Source: Public Records
Mortgage History
| Date | Status | Borrower | Loan Amount |
|---|---|---|---|
| Closed | Morrill Michael S | $120,000 |
Source: Public Records
Tax History
| Year | Tax Paid | Tax Assessment Tax Assessment Total Assessment is a certain percentage of the fair market value that is determined by local assessors to be the total taxable value of land and additions on the property. | Land | Improvement |
|---|---|---|---|---|
| 2025 | $3,953 | $534,490 | -- | -- |
| 2024 | $3,953 | $487,355 | $0 | $0 |
| 2023 | $3,793 | $502,260 | $0 | $0 |
| 2022 | $3,774 | $482,735 | $0 | $0 |
| 2021 | $3,477 | $670,600 | $297,400 | $373,200 |
| 2020 | $2,373 | $247,800 | $247,800 | $0 |
| 2019 | $2,275 | $247,800 | $247,800 | $0 |
| 2018 | $2,286 | $234,800 | $234,800 | $0 |
| 2017 | $2,128 | $213,100 | $0 | $0 |
| 2016 | $1,943 | $180,000 | $0 | $0 |
| 2015 | $692 | $104,400 | $0 | $0 |
| 2014 | $282 | $87,000 | $0 | $0 |
Source: Public Records
Map
Nearby Homes
Your Personal Tour Guide
Ask me questions while you tour the home.