Estimated Value: $575,000 - $586,000
4
Beds
2
Baths
2,613
Sq Ft
$222/Sq Ft
Est. Value
About This Home
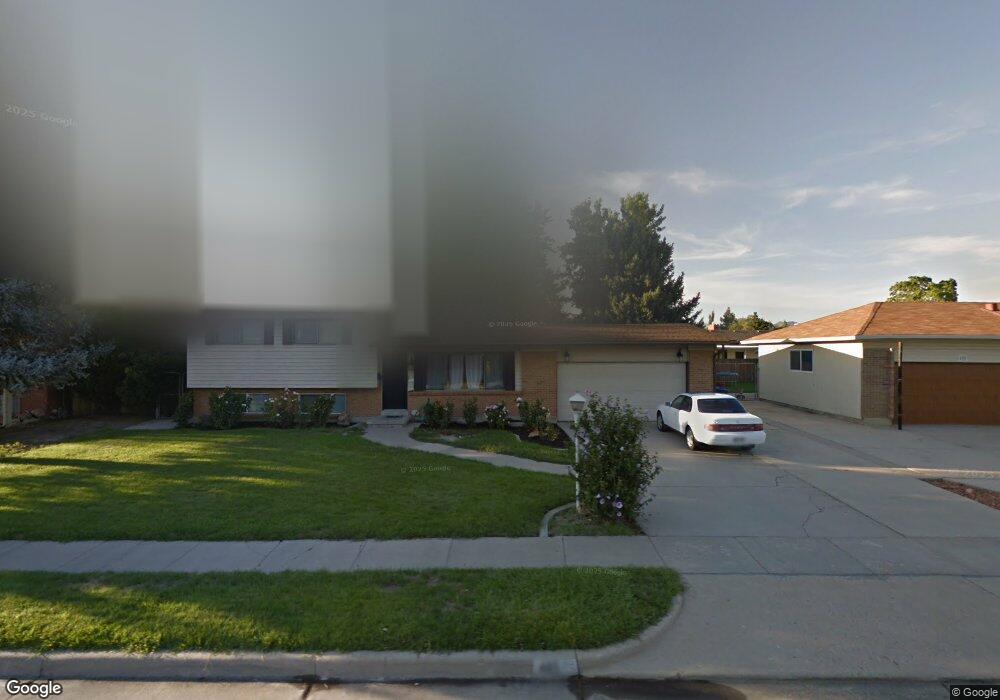
This home is located at 485 E Pioneer Ave, Sandy, UT 84070 and is currently estimated at $580,411, approximately $222 per square foot. 485 E Pioneer Ave is a home located in Salt Lake County with nearby schools including Sandy Elementary School, Mount Jordan Middle School, and Jordan High.
Ownership History
Date
Name
Owned For
Owner Type
Purchase Details
Closed on
Apr 4, 2019
Sold by
Stretchbery Curtis and Stretchbery Desa
Bought by
Pierce Amanda M and Tyrrell Jeremy S
Current Estimated Value
Home Financials for this Owner
Home Financials are based on the most recent Mortgage that was taken out on this home.
Original Mortgage
$274,500
Outstanding Balance
$241,334
Interest Rate
4.3%
Mortgage Type
New Conventional
Estimated Equity
$339,077
Purchase Details
Closed on
Oct 26, 2016
Sold by
Pitts Jenika and Hullings Derrick L
Bought by
Stretchbery Curtis and Stretchbery Desa
Home Financials for this Owner
Home Financials are based on the most recent Mortgage that was taken out on this home.
Original Mortgage
$27,962
Interest Rate
3.5%
Mortgage Type
Commercial
Purchase Details
Closed on
Oct 17, 2011
Sold by
Merlette James B
Bought by
Pitts Jenika and Hullings Derrick L
Home Financials for this Owner
Home Financials are based on the most recent Mortgage that was taken out on this home.
Original Mortgage
$201,752
Interest Rate
3.75%
Mortgage Type
FHA
Purchase Details
Closed on
Feb 25, 2005
Sold by
Hoffman Jo Anne Collier
Bought by
Merlette James B
Home Financials for this Owner
Home Financials are based on the most recent Mortgage that was taken out on this home.
Original Mortgage
$158,720
Interest Rate
5.66%
Mortgage Type
VA
Purchase Details
Closed on
Mar 23, 2004
Sold by
Hoffman Jacob R and Hoffman Jo Anne
Bought by
Hoffman Jo Anne Collier
Home Financials for this Owner
Home Financials are based on the most recent Mortgage that was taken out on this home.
Original Mortgage
$153,772
Interest Rate
5.64%
Mortgage Type
FHA
Purchase Details
Closed on
Sep 29, 2003
Sold by
Hansen Max L
Bought by
Hoffman Joanne
Home Financials for this Owner
Home Financials are based on the most recent Mortgage that was taken out on this home.
Original Mortgage
$152,605
Interest Rate
6.27%
Mortgage Type
FHA
Purchase Details
Closed on
Sep 25, 2003
Sold by
Hoffman Joanne
Bought by
Hoffman Jacob R and Hoffman Jo Anne
Home Financials for this Owner
Home Financials are based on the most recent Mortgage that was taken out on this home.
Original Mortgage
$152,605
Interest Rate
6.27%
Mortgage Type
FHA
Purchase Details
Closed on
Nov 18, 1999
Sold by
Burke Ronald B and Burke Joyce M
Bought by
Hansen Max L
Home Financials for this Owner
Home Financials are based on the most recent Mortgage that was taken out on this home.
Original Mortgage
$40,000
Interest Rate
7.4%
Purchase Details
Closed on
Aug 11, 1995
Sold by
Burke Ronald B and Burke Joyce M
Bought by
Burke Ronald B and Burke Joyce M
Create a Home Valuation Report for This Property
The Home Valuation Report is an in-depth analysis detailing your home's value as well as a comparison with similar homes in the area
Home Values in the Area
Average Home Value in this Area
Purchase History
| Date | Buyer | Sale Price | Title Company |
|---|---|---|---|
| Pierce Amanda M | -- | Vanguard Title Union Park | |
| Stretchbery Curtis | -- | Title Guarantee S Jordan | |
| Pitts Jenika | -- | Meridian Title | |
| Merlette James B | -- | Title Ins Agcy Inc | |
| Hoffman Jo Anne Collier | -- | Equity Title | |
| Hoffman Joanne | -- | Title Ins Agcy Inc | |
| Hoffman Jacob R | -- | Title Ins Agcy Inc | |
| Hansen Max L | -- | United Title Services | |
| Burke Ronald B | -- | -- |
Source: Public Records
Mortgage History
| Date | Status | Borrower | Loan Amount |
|---|---|---|---|
| Open | Pierce Amanda M | $274,500 | |
| Previous Owner | Stretchbery Curtis | $27,962 | |
| Previous Owner | Stretchbery Curtis | $223,920 | |
| Previous Owner | Pitts Jenika | $201,752 | |
| Previous Owner | Merlette James B | $158,720 | |
| Previous Owner | Hoffman Jo Anne Collier | $153,772 | |
| Previous Owner | Hoffman Joanne | $152,605 | |
| Previous Owner | Hansen Max L | $40,000 |
Source: Public Records
Tax History
| Year | Tax Paid | Tax Assessment Tax Assessment Total Assessment is a certain percentage of the fair market value that is determined by local assessors to be the total taxable value of land and additions on the property. | Land | Improvement |
|---|---|---|---|---|
| 2025 | $2,832 | $535,800 | $128,500 | $407,300 |
| 2024 | $2,832 | $523,700 | $120,800 | $402,900 |
| 2023 | $2,456 | $452,800 | $114,800 | $338,000 |
| 2022 | $2,616 | $471,300 | $112,600 | $358,700 |
| 2021 | $2,327 | $356,800 | $97,900 | $258,900 |
| 2020 | $2,224 | $321,600 | $79,300 | $242,300 |
| 2019 | $2,127 | $299,700 | $79,300 | $220,400 |
| 2018 | $1,967 | $288,600 | $79,300 | $209,300 |
| 2017 | $1,894 | $265,400 | $70,500 | $194,900 |
| 2016 | $1,805 | $244,600 | $70,500 | $174,100 |
| 2015 | $1,841 | $230,800 | $73,300 | $157,500 |
| 2014 | $1,793 | $220,300 | $71,200 | $149,100 |
Source: Public Records
Map
Nearby Homes
- 635 Pioneer Ave
- 8322 S Levine Ln Unit 111
- 359 E 8400 S
- 8459 S 300 E
- 627 E 8680 S
- 744 E 8425 S
- 8390 S 745 E
- 8732 S 620 E
- 227 E St Germain Way
- 412 E 8760 S
- 270 E 8680 S
- 608 E 8800 S
- 220 E Pioneer Ave
- 194 Pioneer Ave
- 8729 S Leafwood Ln
- 8722 S Oakwood Park Cir
- 8797 Green Way Unit 3
- 8732 S Oakwood Park Cr
- 149 E Pioneer Ave
- 8087 S 615 E
- 485 Pioneer Ave
- 495 Pioneer Ave
- 495 E Pioneer Ave
- 475 E Pioneer Ave
- 475 Pioneer Ave
- 490 E 8490 S
- 498 E 8490 S
- 482 E 8490 S
- 8516 S 520 E
- 465 Pioneer Ave
- 486 Pioneer Ave
- 476 E Pioneer Ave
- 476 Pioneer Ave
- 496 E Pioneer Ave
- 496 Pioneer Ave
- 8506 S 520 E
- 472 E 8490 S
- 466 Pioneer Ave
- 8544 S 520 E
- 455 E Pioneer Ave
Your Personal Tour Guide
Ask me questions while you tour the home.