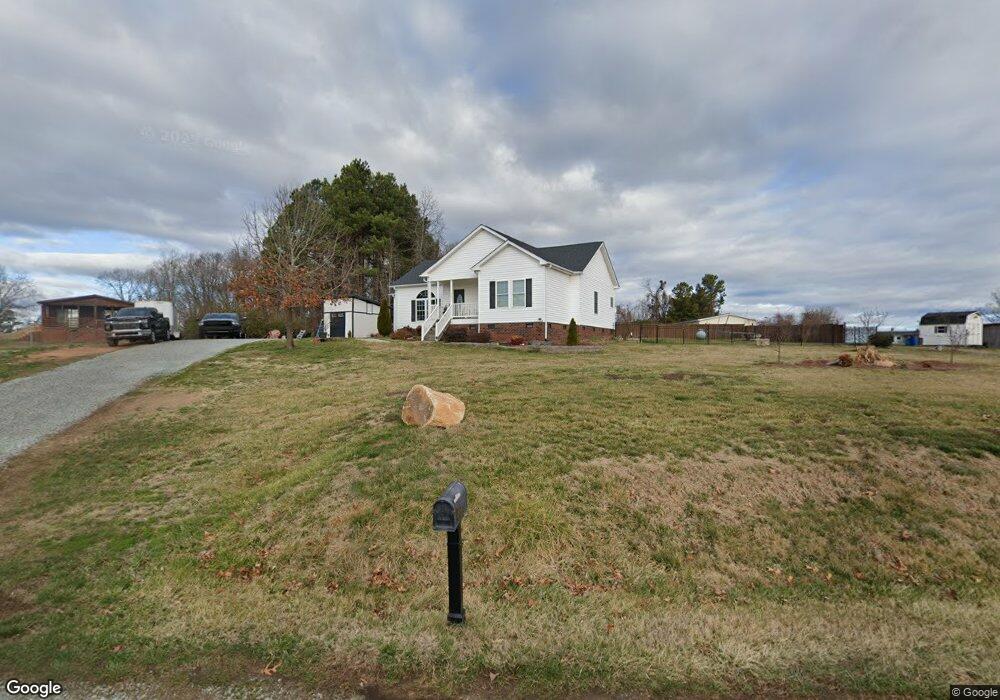
485 Jones Lester Rd Roxboro, NC 27574
Estimated Value: $235,000 - $292,000
3
Beds
3
Baths
1,700
Sq Ft
$156/Sq Ft
Est. Value
About This Home
This home is located at 485 Jones Lester Rd, Roxboro, NC 27574 and is currently estimated at $265,667, approximately $156 per square foot. 485 Jones Lester Rd is a home located in Person County with nearby schools including Person High School, Roxboro Community School, and Roxboro Christian Academy.
Ownership History
Date
Name
Owned For
Owner Type
Purchase Details
Closed on
Sep 25, 2019
Sold by
Briggs Osborne Adam Richard and Briggs Osborne Megan
Bought by
Morales Raul De La Cruz and Velazquez Anita
Current Estimated Value
Home Financials for this Owner
Home Financials are based on the most recent Mortgage that was taken out on this home.
Original Mortgage
$171,717
Outstanding Balance
$150,123
Interest Rate
3.4%
Mortgage Type
New Conventional
Estimated Equity
$115,544
Purchase Details
Closed on
Sep 30, 2015
Sold by
Us Bank Na
Bought by
Osborne Adam Richard
Home Financials for this Owner
Home Financials are based on the most recent Mortgage that was taken out on this home.
Original Mortgage
$109,971
Interest Rate
4.4%
Mortgage Type
FHA
Purchase Details
Closed on
Mar 13, 2015
Sold by
Hicks Sylvia and Hicks Theodore R
Bought by
Us Bank Na
Create a Home Valuation Report for This Property
The Home Valuation Report is an in-depth analysis detailing your home's value as well as a comparison with similar homes in the area
Home Values in the Area
Average Home Value in this Area
Purchase History
| Date | Buyer | Sale Price | Title Company |
|---|---|---|---|
| Morales Raul De La Cruz | $170,000 | None Available | |
| Osborne Adam Richard | $112,000 | Servicelink | |
| Us Bank Na | $108,000 | None Available |
Source: Public Records
Mortgage History
| Date | Status | Borrower | Loan Amount |
|---|---|---|---|
| Open | Morales Raul De La Cruz | $171,717 | |
| Previous Owner | Osborne Adam Richard | $109,971 |
Source: Public Records
Tax History Compared to Growth
Tax History
| Year | Tax Paid | Tax Assessment Tax Assessment Total Assessment is a certain percentage of the fair market value that is determined by local assessors to be the total taxable value of land and additions on the property. | Land | Improvement |
|---|---|---|---|---|
| 2025 | $1,703 | $252,714 | $0 | $0 |
| 2024 | $1,371 | $176,154 | $0 | $0 |
| 2023 | $1,367 | $176,154 | $0 | $0 |
| 2022 | $1,362 | $176,154 | $0 | $0 |
| 2021 | $1,323 | $176,154 | $0 | $0 |
| 2020 | $1,142 | $151,921 | $0 | $0 |
| 2019 | $1,157 | $151,921 | $0 | $0 |
| 2018 | $1,085 | $151,921 | $0 | $0 |
| 2017 | $1,069 | $151,921 | $0 | $0 |
| 2016 | $180 | $151,921 | $0 | $0 |
| 2015 | $1,087 | $154,462 | $0 | $0 |
| 2014 | $1,087 | $154,462 | $0 | $0 |
Source: Public Records
Map
Nearby Homes
- 811 Jones Lester Rd
- 305 Lochridge Dr
- 102 Scotland Place
- 9 Buttonwood Ln
- 2 Semora Rd
- 7710 Leasburg Rd
- 382 Wimbledon Dr
- 74 Alleghany Dr
- 421 S Morgan St
- 167.10 Leasburg Rd
- 814 Frank St
- 60 Banbury Ct
- 240 Crestwood Dr
- 209 Reade Dr
- 41 Lakewood Dr
- 307 W Gordon St
- 208 S Morgan St
- 515 Reams Ave
- 131 Rosewood Dr
- 305 W Barden St
- 515 Jones Lester Rd
- 494 Jones Lester Rd
- 434 Jones Lester Rd
- 419 Jones Lester Rd
- 549 Jones Lester Rd
- 432 Jones Lester Rd
- 75 Hickson Rd
- 61 Jessie Hicks Rd
- 86 Jessie Hicks Rd
- 568 Jones Lester Rd
- 395 Jones Lester Rd
- 589 Jones Lester Rd
- 106 Jessie Hicks Rd
- 101 Jessie Hicks Rd
- 361 Jones Lester Rd
- 126 Jessie Hicks Rd
- 606 Jones Lester Rd
- 621 Jones Lester Rd
- 144 Jessie Hicks Rd
- 628 Jones Lester Rd