Estimated Value: $943,000 - $1,239,000
3
Beds
3
Baths
2,432
Sq Ft
$439/Sq Ft
Est. Value
About This Home
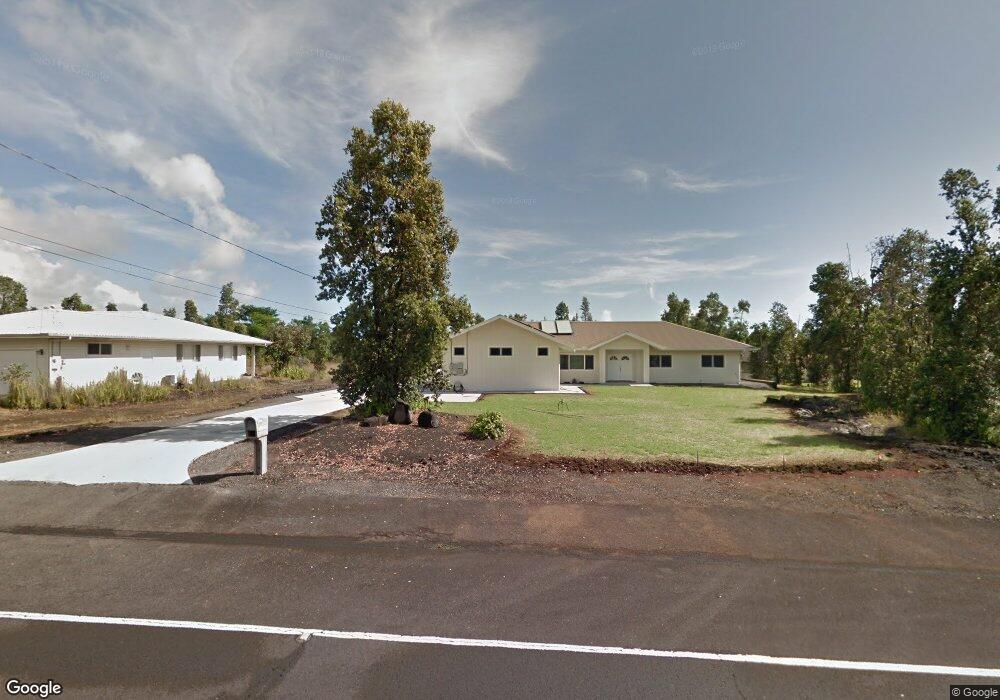
This home is located at 485 Kipuni St, Hilo, HI 96720 and is currently estimated at $1,066,450, approximately $438 per square foot. 485 Kipuni St is a home located in Hawaii County with nearby schools including Chiefess Kapiolani Elementary School, Hilo Intermediate School, and Hilo High School.
Ownership History
Date
Name
Owned For
Owner Type
Purchase Details
Closed on
May 22, 2023
Sold by
Honda Eric Tadao and Honda Amy Sachiko
Bought by
Eric Tadao Honda And Amy Sachiko Honda Revoca and Honda
Current Estimated Value
Purchase Details
Closed on
Apr 14, 2004
Sold by
Honda Albert Akira and Honda Aileen Eiko
Bought by
Honda Eric Tadao and Honda Amy Sachiko
Home Financials for this Owner
Home Financials are based on the most recent Mortgage that was taken out on this home.
Original Mortgage
$210,000
Interest Rate
5.35%
Mortgage Type
Construction
Create a Home Valuation Report for This Property
The Home Valuation Report is an in-depth analysis detailing your home's value as well as a comparison with similar homes in the area
Home Values in the Area
Average Home Value in this Area
Purchase History
| Date | Buyer | Sale Price | Title Company |
|---|---|---|---|
| Eric Tadao Honda And Amy Sachiko Honda Revoca | -- | None Listed On Document | |
| Honda Eric Tadao | -- | -- |
Source: Public Records
Mortgage History
| Date | Status | Borrower | Loan Amount |
|---|---|---|---|
| Previous Owner | Honda Eric Tadao | $210,000 |
Source: Public Records
Tax History Compared to Growth
Tax History
| Year | Tax Paid | Tax Assessment Tax Assessment Total Assessment is a certain percentage of the fair market value that is determined by local assessors to be the total taxable value of land and additions on the property. | Land | Improvement |
|---|---|---|---|---|
| 2025 | $3,976 | $842,700 | $234,700 | $608,000 |
| 2024 | $3,976 | $818,200 | $234,700 | $583,500 |
| 2023 | $3,963 | $794,400 | $234,700 | $559,700 |
| 2022 | $4,006 | $771,300 | $234,700 | $536,600 |
| 2021 | $3,867 | $748,800 | $234,700 | $514,100 |
| 2020 | $3,733 | $727,000 | $223,000 | $504,000 |
| 2019 | $3,614 | $707,700 | $214,700 | $493,000 |
| 2018 | $3,488 | $687,100 | $211,200 | $475,900 |
| 2017 | $3,365 | $667,100 | $205,000 | $462,100 |
| 2016 | $3,245 | $647,700 | $205,000 | $442,700 |
| 2015 | $2,580 | $628,800 | $205,000 | $423,800 |
| 2014 | $2,580 | $623,600 | $200,000 | $423,600 |
Source: Public Records
Map
Nearby Homes
- 901 Kukuau St
- 497 Makanaa St
- 378 Kahikini St
- 0 Kukuau St Unit 721423
- 708 Kukuau St
- 698 Kukuau St
- 161 Uluwai St
- 27 Uluwai St
- 420 Huali Place
- 511 Kaanini St
- 24 Manu Place
- 28 S Wiliwili St
- 199 Kaumana Dr
- 55 Omao St
- 105 Lahaina St
- 61 Pakalana St
- 1088 Apono Place
- 14 Puu Hina St
- 483 Hoopuni St
- 879 Waianuenue Ave