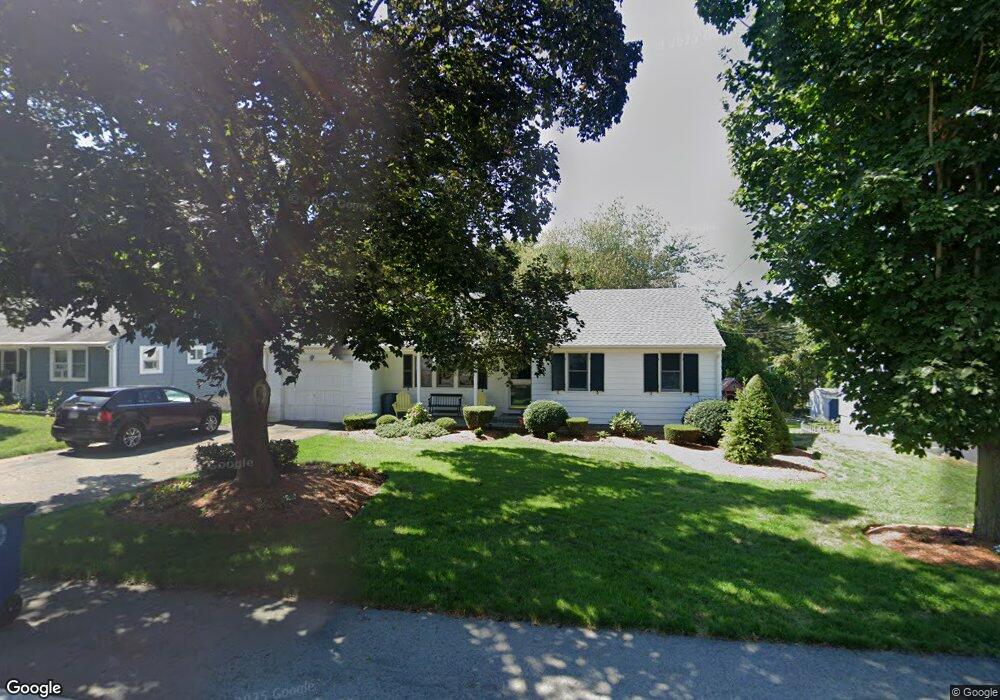
485 Middle St Braintree, MA 02184
East Braintree NeighborhoodEstimated Value: $628,000 - $735,000
3
Beds
2
Baths
1,560
Sq Ft
$433/Sq Ft
Est. Value
About This Home
This home is located at 485 Middle St, Braintree, MA 02184 and is currently estimated at $675,848, approximately $433 per square foot. 485 Middle St is a home located in Norfolk County with nearby schools including Braintree High School, Sacred Heart Elementary School, and Thayer Academy.
Ownership History
Date
Name
Owned For
Owner Type
Purchase Details
Closed on
Oct 17, 2006
Sold by
Sullivan Rt and Sullivan Josephine M
Bought by
Sullivan James B and Beck-Sullivan Shawna R
Current Estimated Value
Home Financials for this Owner
Home Financials are based on the most recent Mortgage that was taken out on this home.
Original Mortgage
$200,000
Outstanding Balance
$119,410
Interest Rate
6.47%
Mortgage Type
Purchase Money Mortgage
Estimated Equity
$556,438
Create a Home Valuation Report for This Property
The Home Valuation Report is an in-depth analysis detailing your home's value as well as a comparison with similar homes in the area
Home Values in the Area
Average Home Value in this Area
Purchase History
| Date | Buyer | Sale Price | Title Company |
|---|---|---|---|
| Sullivan James B | $250,000 | -- | |
| Sullivan James B | $250,000 | -- |
Source: Public Records
Mortgage History
| Date | Status | Borrower | Loan Amount |
|---|---|---|---|
| Open | Sullivan James B | $200,000 | |
| Closed | Sullivan James B | $25,000 | |
| Closed | Sullivan James B | $200,000 |
Source: Public Records
Tax History Compared to Growth
Tax History
| Year | Tax Paid | Tax Assessment Tax Assessment Total Assessment is a certain percentage of the fair market value that is determined by local assessors to be the total taxable value of land and additions on the property. | Land | Improvement |
|---|---|---|---|---|
| 2025 | $5,287 | $529,800 | $306,900 | $222,900 |
| 2024 | $4,800 | $506,300 | $288,300 | $218,000 |
| 2023 | $4,546 | $465,800 | $260,400 | $205,400 |
| 2022 | $4,450 | $447,200 | $241,800 | $205,400 |
| 2021 | $4,139 | $416,000 | $223,200 | $192,800 |
| 2020 | $3,918 | $397,400 | $204,600 | $192,800 |
| 2019 | $3,801 | $376,700 | $204,600 | $172,100 |
| 2018 | $3,708 | $351,800 | $186,000 | $165,800 |
| 2017 | $3,579 | $333,200 | $167,400 | $165,800 |
| 2016 | $3,411 | $310,700 | $148,800 | $161,900 |
| 2015 | $3,346 | $302,300 | $140,400 | $161,900 |
| 2014 | $3,147 | $275,600 | $133,900 | $141,700 |
Source: Public Records
Map
Nearby Homes
- 605 Middle St Unit 38
- 230 Lisle St
- 71 Robbie Rd
- 67 Abby Rd
- 42 Spring St
- 685 Union St
- 51 Faxon St
- 428 John Mahar Hwy Unit 301
- 414 John Mahar Hwy Unit 312
- 21 Faxon St
- 418 John Mahar Hwy Unit 408
- 426 John Mahar Hwy Unit 311
- 422 John Mahar Hwy Unit 305
- 491 Washington St Unit 1
- 14-20 Randall Ave
- 420 John Mahar Hwy Unit 202
- 15 Summer St
- 31 Tingley Rd
- 48 Apple Tree Ln
- 145 Commercial St Unit 3