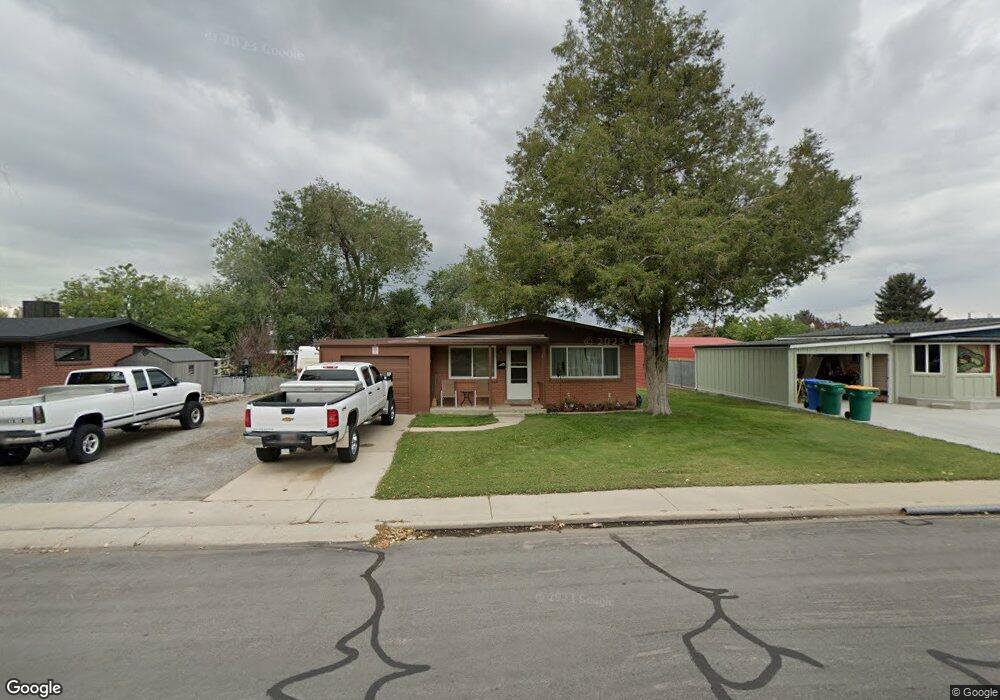
485 N 600 E Orem, UT 84097
Orchard South NeighborhoodEstimated Value: $404,000 - $417,710
3
Beds
1
Bath
1,092
Sq Ft
$376/Sq Ft
Est. Value
About This Home
This home is located at 485 N 600 E, Orem, UT 84097 and is currently estimated at $410,570, approximately $375 per square foot. 485 N 600 E is a home located in Utah County with nearby schools including Cascade Elementary School, Canyon View Junior High School, and Orem High School.
Ownership History
Date
Name
Owned For
Owner Type
Purchase Details
Closed on
Dec 20, 2022
Sold by
Mangum Keith Sheldon
Bought by
Mangum Keith Sheldon and Johnson Nicole Jean
Current Estimated Value
Purchase Details
Closed on
Oct 14, 1998
Sold by
Mangum Keith Sheldon and Mangum Kerry S
Bought by
Mangum Keith Sheldon
Home Financials for this Owner
Home Financials are based on the most recent Mortgage that was taken out on this home.
Original Mortgage
$36,900
Interest Rate
6.71%
Create a Home Valuation Report for This Property
The Home Valuation Report is an in-depth analysis detailing your home's value as well as a comparison with similar homes in the area
Home Values in the Area
Average Home Value in this Area
Purchase History
| Date | Buyer | Sale Price | Title Company |
|---|---|---|---|
| Mangum Keith Sheldon | -- | Northern Title Company | |
| Mangum Keith Sheldon | -- | Superior Title Company |
Source: Public Records
Mortgage History
| Date | Status | Borrower | Loan Amount |
|---|---|---|---|
| Previous Owner | Mangum Keith Sheldon | $36,900 |
Source: Public Records
Tax History
| Year | Tax Paid | Tax Assessment Tax Assessment Total Assessment is a certain percentage of the fair market value that is determined by local assessors to be the total taxable value of land and additions on the property. | Land | Improvement |
|---|---|---|---|---|
| 2025 | $1,536 | $198,605 | -- | -- |
| 2024 | $1,536 | $187,770 | $0 | $0 |
| 2023 | $1,420 | $186,615 | $0 | $0 |
| 2022 | $1,552 | $197,615 | $0 | $0 |
| 2021 | $1,419 | $273,600 | $148,400 | $125,200 |
| 2020 | $1,274 | $241,400 | $118,700 | $122,700 |
| 2019 | $1,165 | $229,700 | $111,200 | $118,500 |
| 2018 | $1,127 | $212,300 | $107,500 | $104,800 |
| 2017 | $1,022 | $103,125 | $0 | $0 |
| 2016 | $961 | $89,375 | $0 | $0 |
| 2015 | -- | $79,805 | $0 | $0 |
| 2014 | $906 | $79,310 | $0 | $0 |
Source: Public Records
Map
Nearby Homes
Your Personal Tour Guide
Ask me questions while you tour the home.