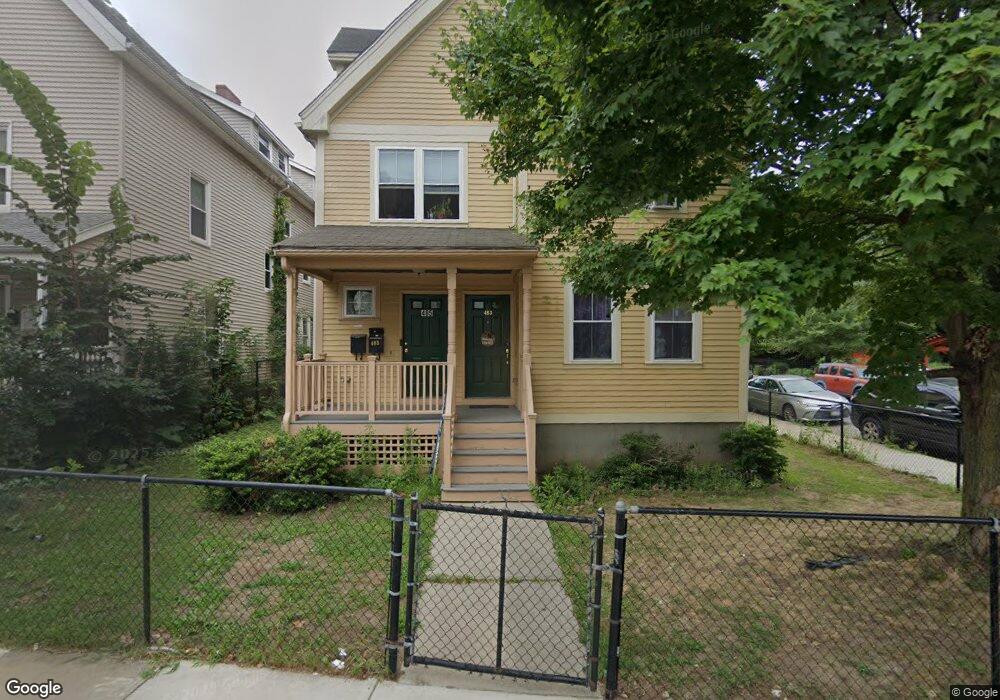
485 Quincy St Dorchester, MA 02125
Bowdoin North-Mount Bowdoin NeighborhoodEstimated Value: $705,688 - $879,000
4
Beds
2
Baths
3,292
Sq Ft
$240/Sq Ft
Est. Value
About This Home
This home is located at 485 Quincy St, Dorchester, MA 02125 and is currently estimated at $789,172, approximately $239 per square foot. 485 Quincy St is a home located in Suffolk County with nearby schools including UP Academy Charter School of Dorchester and Uncommon Schools Roxbury Prep Dorchester Campus.
Ownership History
Date
Name
Owned For
Owner Type
Purchase Details
Closed on
Jul 26, 2004
Sold by
Db Hsg Inc
Bought by
Valdez Veronica
Current Estimated Value
Home Financials for this Owner
Home Financials are based on the most recent Mortgage that was taken out on this home.
Original Mortgage
$150,150
Interest Rate
6.28%
Mortgage Type
Purchase Money Mortgage
Create a Home Valuation Report for This Property
The Home Valuation Report is an in-depth analysis detailing your home's value as well as a comparison with similar homes in the area
Home Values in the Area
Average Home Value in this Area
Purchase History
| Date | Buyer | Sale Price | Title Company |
|---|---|---|---|
| Valdez Veronica | $195,000 | -- |
Source: Public Records
Mortgage History
| Date | Status | Borrower | Loan Amount |
|---|---|---|---|
| Open | Valdez Veronica | $96,300 | |
| Closed | Valdez Veronica | $75,000 | |
| Closed | Valdez Veronica | $150,150 | |
| Closed | Valdez Veronica | $39,000 |
Source: Public Records
Tax History Compared to Growth
Tax History
| Year | Tax Paid | Tax Assessment Tax Assessment Total Assessment is a certain percentage of the fair market value that is determined by local assessors to be the total taxable value of land and additions on the property. | Land | Improvement |
|---|---|---|---|---|
| 2025 | $5,994 | $517,600 | $170,808 | $346,792 |
| 2024 | $5,374 | $493,000 | $133,110 | $359,890 |
| 2023 | $5,042 | $469,500 | $126,765 | $342,735 |
| 2022 | $4,864 | $447,100 | $120,717 | $326,383 |
| 2021 | $4,543 | $425,800 | $0 | $425,800 |
| 2020 | $4,282 | $405,500 | $0 | $405,500 |
| 2019 | $4,071 | $386,200 | $132,000 | $254,200 |
| 2018 | $3,855 | $367,800 | $132,000 | $235,800 |
| 2017 | $3,710 | $350,300 | $132,000 | $218,300 |
| 2016 | $3,670 | $333,600 | $132,000 | $201,600 |
| 2015 | $3,847 | $317,700 | $121,400 | $196,300 |
| 2014 | $3,807 | $302,600 | $121,400 | $181,200 |
Source: Public Records
Map
Nearby Homes
- 19 Mount Ida Rd
- 70-72 Clarkson St
- 35-37 Clarkson St
- 33 Adams St Unit 3
- 33 Adams St Unit 1
- 7 Fox St Unit 1
- 52 Bellevue St Unit 1
- 52 Bellevue St Unit 3
- 52 Bellevue St Unit 2
- 53 Mount Ida Rd Unit 1
- 76 Bellevue St
- 70 Hamilton St
- 69 Mount Ida Rd Unit 1
- 60 Stanley St Unit 301
- 60 Stanley St Unit 302
- 60 Stanley St
- 60 Stanley St Unit 101
- 22 Ronan St
- 3 Ware St
- 51 Hamilton St Unit 3
- 487 Quincy St
- 36-38 Coleman St
- 36 Coleman St Unit 38
- 36 Coleman St Unit 2
- 36 Coleman St Unit 36
- 36-38 Coleman St Unit 38
- 36-38 Coleman St Unit 2
- 486 Quincy St
- 486 Quincy St Unit 3
- 488 Quincy St Unit 2
- 488 Quincy St
- 488 Quincy St Unit 3
- 42 Coleman St Unit 1
- 42 Coleman St
- 40 Coleman St Unit 42
- 40 Coleman St Unit 1
- 490 Quincy St Unit 2
- 490 Quincy St
- 490 Quincy St Unit 1
- 491r Quincy St