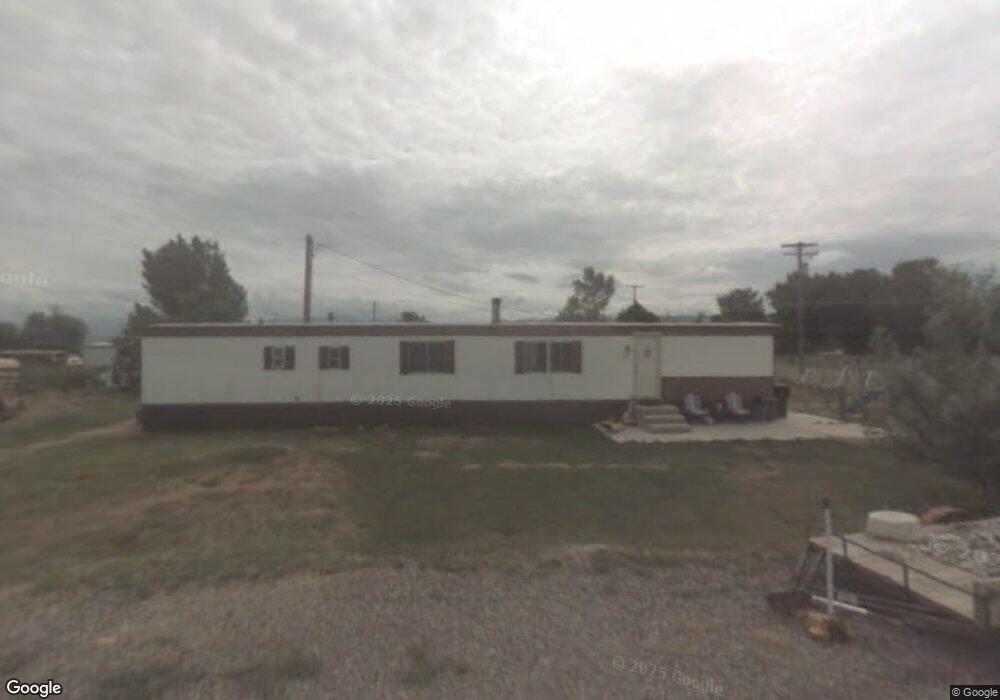
485 S 100 E Redmond, UT 84652
Estimated Value: $91,000 - $179,000
Studio
--
Bath
924
Sq Ft
$143/Sq Ft
Est. Value
About This Home
This home is located at 485 S 100 E, Redmond, UT 84652 and is currently estimated at $131,856, approximately $142 per square foot. 485 S 100 E is a home with nearby schools including Salina School, North Sevier Middle School, and North Sevier High School.
Ownership History
Date
Name
Owned For
Owner Type
Purchase Details
Closed on
Dec 13, 2018
Sold by
Jjs Family Llc Series Two Redmond
Bought by
Otten Russell and Otten Taunya
Current Estimated Value
Purchase Details
Closed on
Jan 8, 2016
Sold by
Purper Don M
Bought by
Purper Don M
Home Financials for this Owner
Home Financials are based on the most recent Mortgage that was taken out on this home.
Original Mortgage
$69,485
Interest Rate
3.92%
Purchase Details
Closed on
Aug 31, 2006
Sold by
Purper Don M
Bought by
Purper Don M and Don M Purper Trust
Create a Home Valuation Report for This Property
The Home Valuation Report is an in-depth analysis detailing your home's value as well as a comparison with similar homes in the area
Purchase History
| Date | Buyer | Sale Price | Title Company |
|---|---|---|---|
| Otten Russell | -- | None Available | |
| Purper Don M | -- | Utah Title & Abstra | |
| Purper Don M | -- | Utah Title & Abstra |
Source: Public Records
Mortgage History
| Date | Status | Borrower | Loan Amount |
|---|---|---|---|
| Previous Owner | Purper Don M | $69,485 |
Source: Public Records
Tax History
| Year | Tax Paid | Tax Assessment Tax Assessment Total Assessment is a certain percentage of the fair market value that is determined by local assessors to be the total taxable value of land and additions on the property. | Land | Improvement |
|---|---|---|---|---|
| 2025 | $608 | $71,888 | $54,969 | $16,919 |
| 2024 | $608 | $64,196 | $46,992 | $17,204 |
| 2023 | $504 | $64,509 | $47,163 | $17,346 |
| 2022 | $793 | $80,164 | $47,679 | $32,485 |
| 2021 | $658 | $55,053 | $28,750 | $26,303 |
| 2020 | $605 | $47,432 | $28,750 | $18,682 |
| 2019 | $559 | $46,790 | $28,750 | $18,040 |
| 2018 | $293 | $21,730 | $14,230 | $7,500 |
| 2017 | $299 | $21,170 | $14,230 | $6,940 |
| 2016 | $274 | $21,180 | $0 | $0 |
| 2015 | $274 | $21,540 | $0 | $0 |
| 2014 | $274 | $22,740 | $0 | $0 |
Source: Public Records
Map
Nearby Homes
Your Personal Tour Guide
Ask me questions while you tour the home.