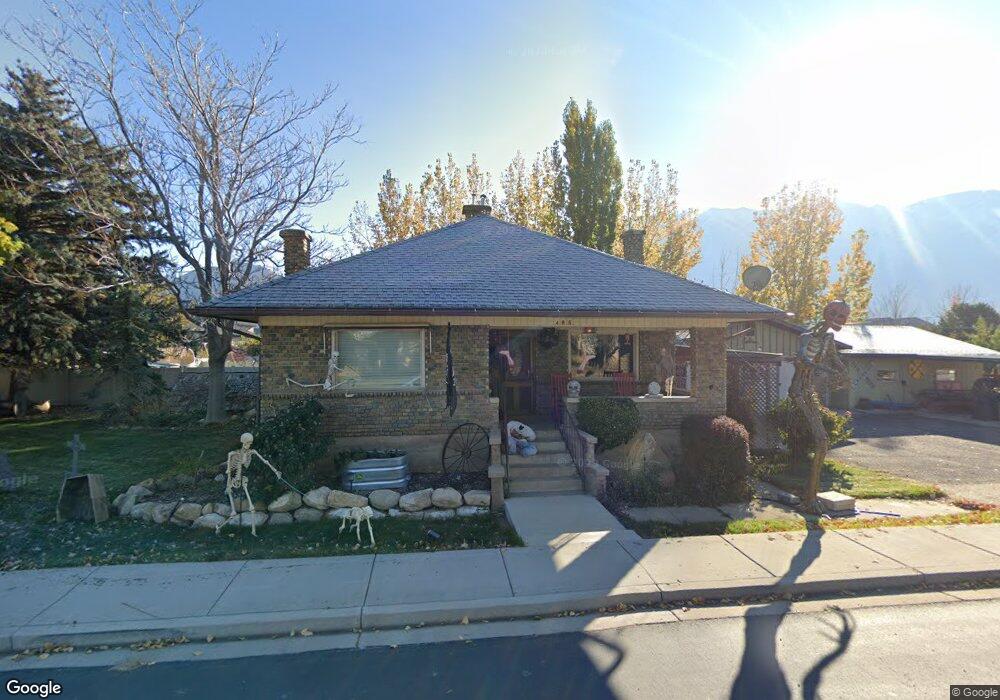
485 S 800 W Mapleton, UT 84664
Estimated Value: $781,000 - $887,000
3
Beds
2
Baths
2,773
Sq Ft
$298/Sq Ft
Est. Value
About This Home
This home is located at 485 S 800 W, Mapleton, UT 84664 and is currently estimated at $827,656, approximately $298 per square foot. 485 S 800 W is a home located in Utah County with nearby schools including Mapleton School, Mapleton Junior High School, and Maple Mountain High School.
Ownership History
Date
Name
Owned For
Owner Type
Purchase Details
Closed on
Jul 8, 2014
Sold by
Lewis Lucille W
Bought by
Olsen Joshua
Current Estimated Value
Home Financials for this Owner
Home Financials are based on the most recent Mortgage that was taken out on this home.
Original Mortgage
$234,135
Outstanding Balance
$177,737
Interest Rate
4.07%
Mortgage Type
New Conventional
Estimated Equity
$649,919
Purchase Details
Closed on
Oct 17, 2013
Sold by
Lewis Jeffrey
Bought by
Lewis Lucielle W
Purchase Details
Closed on
Jun 17, 2013
Sold by
Lewis Lucille W
Bought by
Lewis Jeffrey
Purchase Details
Closed on
Apr 30, 2013
Sold by
Lewis Lucille W
Bought by
Lewis Lucille W
Purchase Details
Closed on
Sep 3, 2002
Sold by
Hansen Lois W
Bought by
Lewis Richard L and Lewis Lucille W
Purchase Details
Closed on
Aug 27, 2002
Sold by
Hansen Lois W
Bought by
Hansen Lois W and Lewis Lucille
Purchase Details
Closed on
Nov 5, 1997
Sold by
Wing Lewis M
Bought by
Lynn Richard and Lewis Lucille
Create a Home Valuation Report for This Property
The Home Valuation Report is an in-depth analysis detailing your home's value as well as a comparison with similar homes in the area
Home Values in the Area
Average Home Value in this Area
Purchase History
| Date | Buyer | Sale Price | Title Company |
|---|---|---|---|
| Olsen Joshua | -- | Inwest Title | |
| Lewis Lucielle W | -- | None Available | |
| Lewis Jeffrey | -- | Provo Land Title Co | |
| Lewis Lucille W | -- | None Available | |
| Lewis Lucille W | -- | None Available | |
| Lewis Lucille W | -- | None Available | |
| Lewis Lucille W | -- | None Available | |
| Lewis Richard L | -- | -- | |
| Hansen Lois W | -- | Pro Title & Escrow Inc | |
| Lynn Richard | -- | -- |
Source: Public Records
Mortgage History
| Date | Status | Borrower | Loan Amount |
|---|---|---|---|
| Open | Olsen Joshua | $234,135 |
Source: Public Records
Tax History
| Year | Tax Paid | Tax Assessment Tax Assessment Total Assessment is a certain percentage of the fair market value that is determined by local assessors to be the total taxable value of land and additions on the property. | Land | Improvement |
|---|---|---|---|---|
| 2025 | $2,761 | $353,540 | -- | -- |
| 2024 | $2,761 | $270,490 | $0 | $0 |
| 2023 | $2,738 | $269,940 | $0 | $0 |
| 2022 | $2,732 | $266,255 | $0 | $0 |
| 2021 | $2,207 | $330,300 | $182,300 | $148,000 |
| 2020 | $2,137 | $309,300 | $161,300 | $148,000 |
| 2019 | $1,925 | $284,500 | $155,800 | $128,700 |
| 2018 | $1,702 | $239,400 | $128,300 | $111,100 |
| 2017 | $1,649 | $123,090 | $0 | $0 |
| 2016 | $1,463 | $108,570 | $0 | $0 |
| 2015 | $1,309 | $96,580 | $0 | $0 |
| 2014 | $1,250 | $90,530 | $0 | $0 |
Source: Public Records
Map
Nearby Homes
- 896 W 675 S
- 4664 S 680 W Unit S204
- 4664 S 680 W Unit S203
- 4664 S 680 W Unit S302
- 4664 S 680 W Unit S303
- 4664 S 680 W Unit S201
- 4664 S 680 W Unit S202
- 4664 S 680 W Unit S304
- 4664 S 680 W Unit S301
- 4664 S 680 W Unit S102
- 4664 S 680 W Unit S101
- 509 W 350 S Unit 30
- 509 W 350 S
- 415 S 1200 W
- 1352 W 900 S
- 1222 W 190 N
- 1158 S 980 W
- 1142 W 220 N
- 715 W 4600 S Unit Lot I101
- 715 W 4600 S Unit Lot I303
- 538 N 800 W
- 486 S 800 W Unit 28
- 562 S 700 W Unit 21
- 562 S 700 W Unit 20
- 562 S 700 W
- 480 S 800 W
- 744 W 580 S
- 364 W 350 S Unit 26
- 572 S 700 W Unit 22
- 572 S 700 W Unit 20
- 572 S 700 W
- 475 S 800 W
- 743 W 580 S
- 430 S 800 W
- 546 S 700 W Unit 20
- 733 W 580 S
- 548 S 700 W Unit 20
- 773 W 580 S
- 594 S 800 W
- 385 S 800 W
Your Personal Tour Guide
Ask me questions while you tour the home.