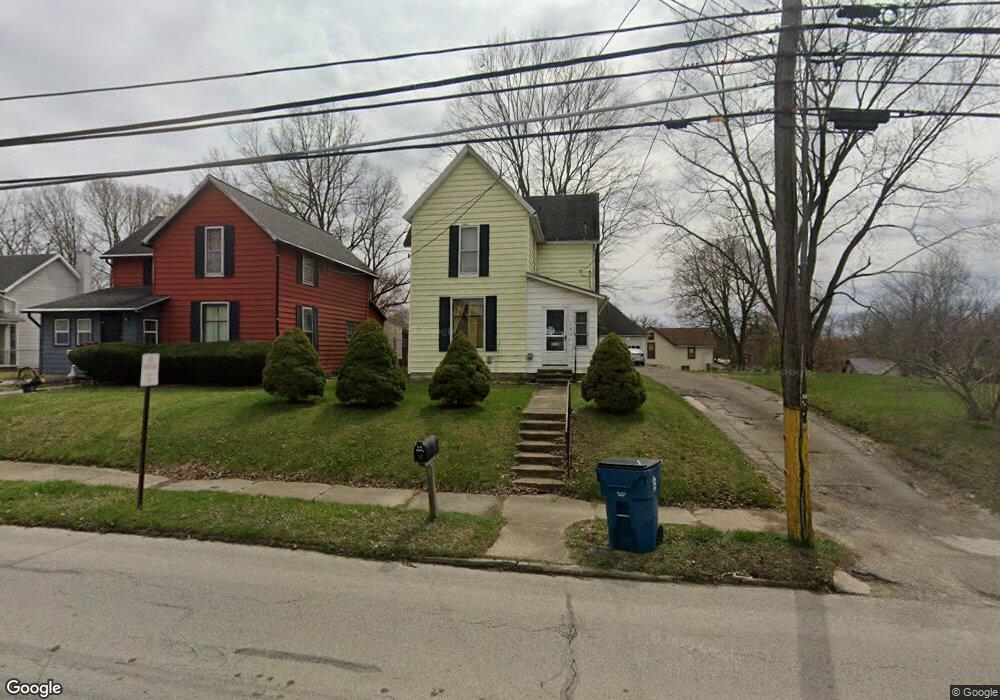
485 Stitt St Wabash, IN 46992
Estimated Value: $109,000 - $166,000
3
Beds
2
Baths
1,284
Sq Ft
$110/Sq Ft
Est. Value
About This Home
This home is located at 485 Stitt St, Wabash, IN 46992 and is currently estimated at $141,432, approximately $110 per square foot. 485 Stitt St is a home located in Wabash County with nearby schools including O.J. Neighbours Elementary School, W C Mills Elementary School, and Wabash Middle School.
Ownership History
Date
Name
Owned For
Owner Type
Purchase Details
Closed on
Jul 18, 2008
Sold by
Blair David W
Bought by
Blair Diana L
Current Estimated Value
Home Financials for this Owner
Home Financials are based on the most recent Mortgage that was taken out on this home.
Original Mortgage
$39,874
Outstanding Balance
$26,099
Interest Rate
6.36%
Mortgage Type
FHA
Estimated Equity
$115,333
Purchase Details
Closed on
Oct 29, 2007
Sold by
Secretary Of Veterans Affairs
Bought by
Blair David W
Home Financials for this Owner
Home Financials are based on the most recent Mortgage that was taken out on this home.
Original Mortgage
$18,685
Interest Rate
6.45%
Mortgage Type
Purchase Money Mortgage
Purchase Details
Closed on
Jan 26, 2007
Sold by
Taylor Bean & Whitaker Mortgage Corp
Bought by
Secretary Of Veterans Affairs
Purchase Details
Closed on
Jan 9, 2007
Sold by
Pascoe Douglas A and Pascoe Sandra K
Bought by
Taylor Bean & Whitaker Mortgage Corp
Create a Home Valuation Report for This Property
The Home Valuation Report is an in-depth analysis detailing your home's value as well as a comparison with similar homes in the area
Home Values in the Area
Average Home Value in this Area
Purchase History
| Date | Buyer | Sale Price | Title Company |
|---|---|---|---|
| Blair Diana L | -- | -- | |
| Blair David W | -- | -- | |
| Secretary Of Veterans Affairs | -- | -- | |
| Taylor Bean & Whitaker Mortgage Corp | $51,116 | -- |
Source: Public Records
Mortgage History
| Date | Status | Borrower | Loan Amount |
|---|---|---|---|
| Open | Blair Diana L | $39,874 | |
| Previous Owner | Blair David W | $18,685 |
Source: Public Records
Tax History Compared to Growth
Tax History
| Year | Tax Paid | Tax Assessment Tax Assessment Total Assessment is a certain percentage of the fair market value that is determined by local assessors to be the total taxable value of land and additions on the property. | Land | Improvement |
|---|---|---|---|---|
| 2024 | $1,066 | $106,600 | $9,400 | $97,200 |
| 2023 | $994 | $105,100 | $9,400 | $95,700 |
| 2022 | $950 | $95,000 | $9,400 | $85,600 |
| 2021 | $744 | $84,800 | $9,400 | $75,400 |
| 2020 | $611 | $78,700 | $9,400 | $69,300 |
| 2019 | $487 | $76,800 | $9,400 | $67,400 |
| 2018 | $451 | $74,300 | $9,400 | $64,900 |
| 2017 | $461 | $71,100 | $9,400 | $61,700 |
| 2016 | $294 | $70,900 | $9,400 | $61,500 |
| 2014 | $246 | $71,900 | $9,400 | $62,500 |
| 2013 | $195 | $70,400 | $9,400 | $61,000 |
Source: Public Records
Map
Nearby Homes
- 495 Stitt St
- 334 Ferry St
- 472 Vermont St
- 492 W Maple St
- 125 N Comstock St
- 153 Ferry St
- 27 N Comstock St
- 102 Stitt St
- 516 W Hill St
- 244 N Miami St
- 387 N Wabash St
- 425 N Huntington St
- 35 E Sinclair St
- 41 Noble St
- 747 N Spring St
- 860 Cambridge Dr
- 905 Sunset Dr
- 1240 Helms Dr
- 945 Sunset Dr
- 643 Fairway Dr
- 473 Stitt St
- 463 Stitt St
- 476 Stitt St
- 486 Stitt St
- 463 N Comstock St
- 486 N Comstock St
- 447 Stitt St
- 494 N Comstock St
- 453 N Comstock St
- 480 N Comstock St
- 468 N Comstock St
- 466 Stitt St
- 423 Stitt St
- 456 Stitt St
- 496 Stitt St
- 452 N Comstock St
- 460 N Fisher St
- 435 N Comstock St
- 442 Stitt St
- 526 Stitt St