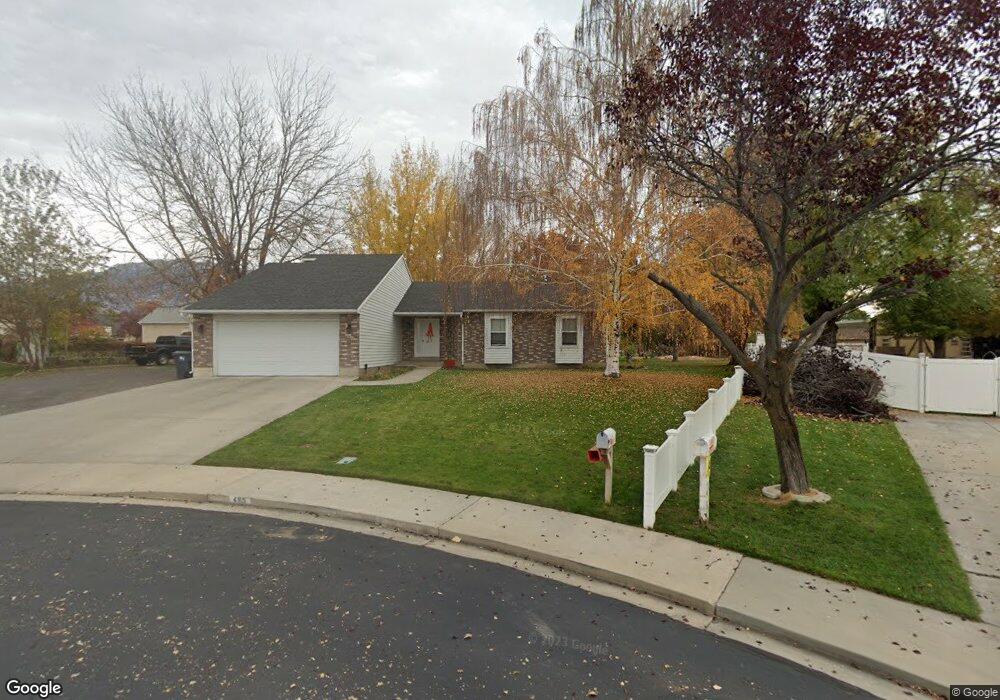
485 W 40 S Lindon, UT 84042
Estimated Value: $624,000 - $790,000
3
Beds
2
Baths
1,575
Sq Ft
$443/Sq Ft
Est. Value
About This Home
This home is located at 485 W 40 S, Lindon, UT 84042 and is currently estimated at $698,440, approximately $443 per square foot. 485 W 40 S is a home located in Utah County with nearby schools including Aspen Elementary School, Oak Canyon Junior High School, and Pleasant Grove High School.
Ownership History
Date
Name
Owned For
Owner Type
Purchase Details
Closed on
Dec 8, 2011
Sold by
Mcalister Val E and Mcalister Marilyn
Bought by
Trane Tracy S and Trane Vickie L
Current Estimated Value
Home Financials for this Owner
Home Financials are based on the most recent Mortgage that was taken out on this home.
Original Mortgage
$219,296
Outstanding Balance
$149,001
Interest Rate
3.87%
Mortgage Type
FHA
Estimated Equity
$549,439
Purchase Details
Closed on
Mar 4, 2011
Sold by
Mcalister Val E and Mcalister Marilyn
Bought by
Mcalister Val E and Mcalister Marilyn
Create a Home Valuation Report for This Property
The Home Valuation Report is an in-depth analysis detailing your home's value as well as a comparison with similar homes in the area
Home Values in the Area
Average Home Value in this Area
Purchase History
| Date | Buyer | Sale Price | Title Company |
|---|---|---|---|
| Trane Tracy S | -- | Inwest Title Services Inc | |
| Mcalister Val E | -- | Inwest Title Services Inc | |
| Mcalister Val E | -- | Accommodation | |
| Mcalister Val E | -- | Accommodation |
Source: Public Records
Mortgage History
| Date | Status | Borrower | Loan Amount |
|---|---|---|---|
| Open | Trane Tracy S | $219,296 |
Source: Public Records
Tax History Compared to Growth
Tax History
| Year | Tax Paid | Tax Assessment Tax Assessment Total Assessment is a certain percentage of the fair market value that is determined by local assessors to be the total taxable value of land and additions on the property. | Land | Improvement |
|---|---|---|---|---|
| 2025 | $2,345 | $312,565 | $238,400 | $329,900 |
| 2024 | $2,345 | $289,135 | $0 | $0 |
| 2023 | $2,159 | $285,890 | $0 | $0 |
| 2022 | $2,190 | $280,115 | $0 | $0 |
| 2021 | $2,007 | $387,000 | $155,000 | $232,000 |
| 2020 | $1,867 | $354,400 | $143,500 | $210,900 |
| 2019 | $1,606 | $318,200 | $134,800 | $183,400 |
| 2018 | $1,585 | $296,000 | $126,100 | $169,900 |
| 2017 | $1,510 | $151,195 | $0 | $0 |
| 2016 | $1,632 | $151,195 | $0 | $0 |
| 2015 | $1,584 | $138,655 | $0 | $0 |
| 2014 | $1,361 | $118,030 | $0 | $0 |
Source: Public Records
Map
Nearby Homes