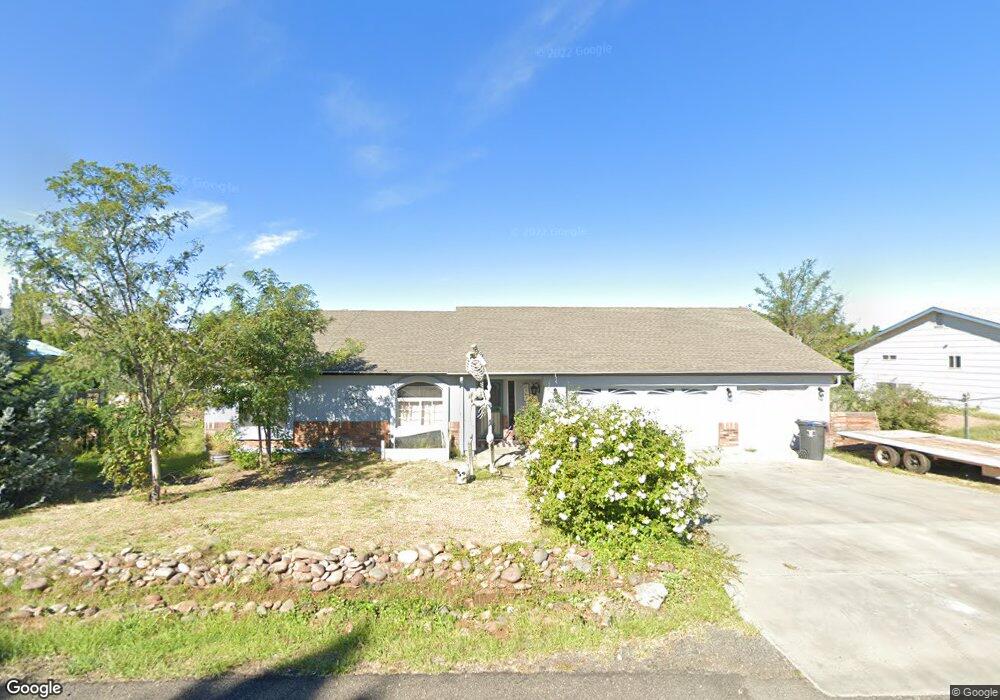
4850 N Spring Dr Prescott Valley, AZ 86314
Estimated Value: $454,272 - $512,000
3
Beds
2
Baths
1,723
Sq Ft
$276/Sq Ft
Est. Value
About This Home
This home is located at 4850 N Spring Dr, Prescott Valley, AZ 86314 and is currently estimated at $475,818, approximately $276 per square foot. 4850 N Spring Dr is a home located in Yavapai County with nearby schools including Granville Elementary School, Bradshaw Mountain Middle School, and Bradshaw Mountain High School.
Ownership History
Date
Name
Owned For
Owner Type
Purchase Details
Closed on
May 17, 2006
Sold by
Taylor Gordon
Bought by
Taylor Gordon William and The Gordon William Taylor Fami
Current Estimated Value
Purchase Details
Closed on
Sep 8, 2005
Sold by
Giles Keith S and Giles Laura E
Bought by
Talyor Gordon
Home Financials for this Owner
Home Financials are based on the most recent Mortgage that was taken out on this home.
Original Mortgage
$200,000
Interest Rate
5.72%
Mortgage Type
New Conventional
Purchase Details
Closed on
Oct 7, 1998
Sold by
Providence Homes Inc
Bought by
Giles Keith S and Giles Laura E
Home Financials for this Owner
Home Financials are based on the most recent Mortgage that was taken out on this home.
Original Mortgage
$121,600
Interest Rate
6.71%
Purchase Details
Closed on
Dec 23, 1997
Sold by
Flynn Michael W and Flynn Bonnie A
Bought by
Providence Development Inc
Create a Home Valuation Report for This Property
The Home Valuation Report is an in-depth analysis detailing your home's value as well as a comparison with similar homes in the area
Home Values in the Area
Average Home Value in this Area
Purchase History
| Date | Buyer | Sale Price | Title Company |
|---|---|---|---|
| Taylor Gordon William | -- | None Available | |
| Talyor Gordon | $275,000 | Chicago Title Ins Co | |
| Giles Keith S | -- | Capital Title Agency | |
| Providence Homes Inc | -- | Capital Title Agency | |
| Providence Development Inc | $20,000 | Capital Title Agency |
Source: Public Records
Mortgage History
| Date | Status | Borrower | Loan Amount |
|---|---|---|---|
| Closed | Talyor Gordon | $200,000 | |
| Previous Owner | Giles Keith S | $121,600 |
Source: Public Records
Tax History Compared to Growth
Tax History
| Year | Tax Paid | Tax Assessment Tax Assessment Total Assessment is a certain percentage of the fair market value that is determined by local assessors to be the total taxable value of land and additions on the property. | Land | Improvement |
|---|---|---|---|---|
| 2026 | $1,844 | $36,988 | -- | -- |
| 2024 | $1,691 | $38,339 | -- | -- |
| 2023 | $1,691 | $31,976 | $4,109 | $27,867 |
| 2022 | $1,663 | $26,375 | $3,309 | $23,066 |
| 2021 | $1,737 | $24,309 | $3,472 | $20,837 |
| 2020 | $1,670 | $0 | $0 | $0 |
| 2019 | $1,649 | $0 | $0 | $0 |
| 2018 | $1,568 | $0 | $0 | $0 |
| 2017 | $1,538 | $0 | $0 | $0 |
| 2016 | $1,485 | $0 | $0 | $0 |
| 2015 | -- | $0 | $0 | $0 |
| 2014 | -- | $0 | $0 | $0 |
Source: Public Records
Map
Nearby Homes
- 4801 N Calle Santa Cruz
- 4881 N Tonto Way
- 4930 N Agua Fria Dr
- 4901 N Treasure Cir
- 4921 N Miner Rd
- 7869 E Spouse Dr
- 4650 N Calle Santa Cruz
- 7316 Spouse Dr
- 38-A1 N Norman Rd
- 5050 N Saddleback Dr
- 3981 N Robert Rd
- 4441 N Tonto Way
- 5035 N Robert Rd
- 7764 E Cocopah Dr
- 4400 N Verde Vista Dr
- 5274 N Western Blvd
- 4895 N Arnold Dr
- 4351 N Verde Vista Dr
- 4350 N Verde Vista Dr
- 5088 N Desert Ln
- 4834 N Spring Dr
- 4868 N Spring Dr
- 4861 N Verde Vista Dr Unit 19
- 4861 N Verde Vista Dr
- 4881 N Verde Vista Dr
- 4881 N Verde Vista Dr Unit 19
- 4841 N Verde Vista Dr
- 4851 N Spring Dr
- 4839 N Spring Dr
- 4816 N Spring Dr
- 4816 N Spring Dr Unit 19
- 4884 N Spring Dr
- 4875 N Spring Dr
- 4901 N Verde Vista Dr
- 4819 N Spring Dr
- 4819 N Spring Dr Unit 19
- 4860 N Verde Vista Dr
- 4820 N Granada Dr
- 4821 N Verde Vista Dr Unit 19
- 4840 N Granada Dr