4851 Cedar Springs Rd Unit 278M Dallas, TX 75219
Oak Lawn NeighborhoodEstimated Value: $163,000 - $213,000
2
Beds
2
Baths
961
Sq Ft
$198/Sq Ft
Est. Value
About This Home
This home is located at 4851 Cedar Springs Rd Unit 278M, Dallas, TX 75219 and is currently estimated at $190,632, approximately $198 per square foot. 4851 Cedar Springs Rd Unit 278M is a home located in Dallas County with nearby schools including Maple Lawn Elementary School, Thomas J. Rusk Middle School, and North Dallas High School.
Ownership History
Date
Name
Owned For
Owner Type
Purchase Details
Closed on
May 9, 2008
Sold by
Bachorowski Gerald A
Bought by
Sologuren Zevallos Jose A
Current Estimated Value
Home Financials for this Owner
Home Financials are based on the most recent Mortgage that was taken out on this home.
Original Mortgage
$64,881
Outstanding Balance
$41,110
Interest Rate
5.89%
Mortgage Type
Purchase Money Mortgage
Estimated Equity
$149,522
Purchase Details
Closed on
Aug 7, 1998
Sold by
Rubenstein Murray and Rubenstein Honora
Bought by
Bachorowski Gerald A
Home Financials for this Owner
Home Financials are based on the most recent Mortgage that was taken out on this home.
Original Mortgage
$26,600
Interest Rate
6.9%
Purchase Details
Closed on
Feb 14, 1997
Sold by
Cardwell R Scott and Dwayne Boyd J
Bought by
Bachorowski Gerald A
Home Financials for this Owner
Home Financials are based on the most recent Mortgage that was taken out on this home.
Original Mortgage
$32,850
Interest Rate
7.85%
Create a Home Valuation Report for This Property
The Home Valuation Report is an in-depth analysis detailing your home's value as well as a comparison with similar homes in the area
Home Values in the Area
Average Home Value in this Area
Purchase History
| Date | Buyer | Sale Price | Title Company |
|---|---|---|---|
| Sologuren Zevallos Jose A | -- | Fnt | |
| Bachorowski Gerald A | -- | -- | |
| Bachorowski Gerald A | -- | -- |
Source: Public Records
Mortgage History
| Date | Status | Borrower | Loan Amount |
|---|---|---|---|
| Open | Sologuren Zevallos Jose A | $64,881 | |
| Previous Owner | Bachorowski Gerald A | $26,600 | |
| Previous Owner | Bachorowski Gerald A | $32,850 |
Source: Public Records
Tax History Compared to Growth
Tax History
| Year | Tax Paid | Tax Assessment Tax Assessment Total Assessment is a certain percentage of the fair market value that is determined by local assessors to be the total taxable value of land and additions on the property. | Land | Improvement |
|---|---|---|---|---|
| 2025 | $1,694 | $206,670 | $65,490 | $141,180 |
| 2024 | $1,694 | $220,340 | $65,490 | $154,850 |
| 2023 | $1,694 | $206,360 | $58,950 | $147,410 |
| 2022 | $3,893 | $155,680 | $58,950 | $96,730 |
| 2021 | $3,930 | $148,960 | $58,950 | $90,010 |
| 2020 | $4,041 | $148,960 | $58,950 | $90,010 |
| 2019 | $4,101 | $144,150 | $58,950 | $85,200 |
| 2018 | $3,920 | $144,150 | $58,950 | $85,200 |
| 2017 | $2,744 | $100,910 | $26,200 | $74,710 |
| 2016 | $2,613 | $96,100 | $26,200 | $69,900 |
| 2015 | $1,084 | $75,920 | $26,200 | $49,720 |
| 2014 | $1,084 | $70,630 | $26,200 | $44,430 |
Source: Public Records
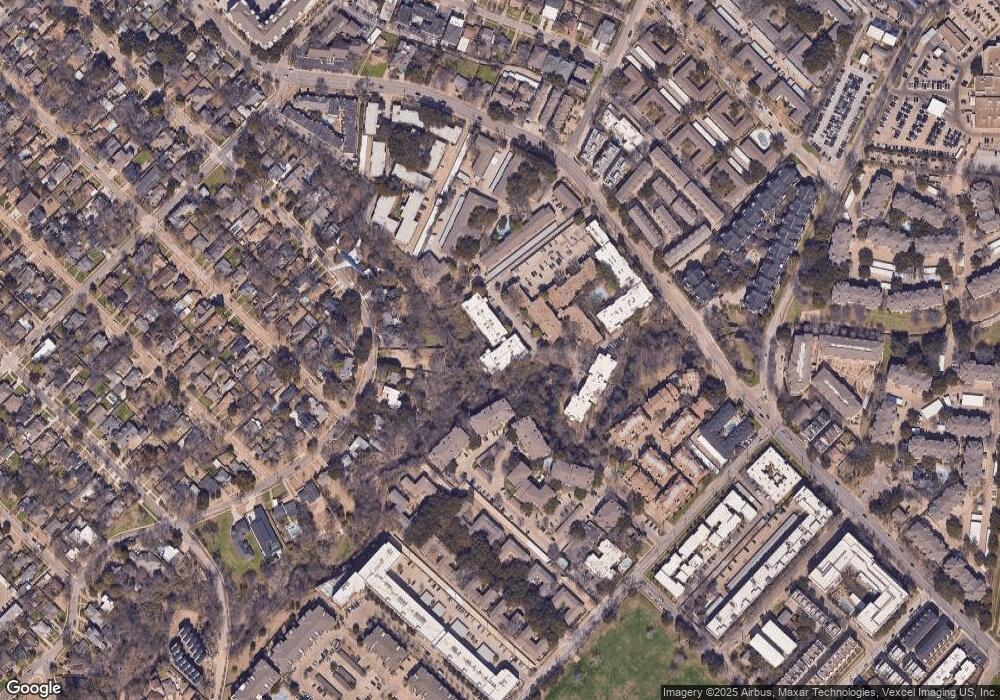
Map
Nearby Homes
- 4845 Cedar Springs Rd Unit 368Q
- 4859 Cedar Springs Rd Unit 144
- 4845 Cedar Springs Rd Unit 167
- 4851 Cedar Springs Rd Unit 281
- 4859 Cedar Springs Rd Unit 157
- 4837 Cedar Springs Rd Unit 215
- 4859 Cedar Springs Rd Unit 362
- 4859 Cedar Springs Rd Unit 240
- 4851 Cedar Springs Rd Unit 182
- 4837 Cedar Springs Rd Unit 211
- 4859 Cedar Springs Rd Unit 254
- 4851 Cedar Springs Rd Unit 383
- 4851 Cedar Springs Rd Unit 292
- 4845 Cedar Springs Rd Unit 170
- 4859 Cedar Springs Rd Unit 142
- 4859 Cedar Springs Rd Unit 150
- 4859 Cedar Springs Rd Unit 337
- 4859 Cedar Springs Rd Unit 336
- 4830 Cedar Springs Rd Unit 32
- 4830 Cedar Springs Rd Unit 30
- 4845 Cedar Springs Rd Unit 268
- 4851 Cedar Springs Rd Unit 286
- 4851 Cedar Springs Rd Unit 187N
- 4859 Cedar Springs Rd Unit 360I
- 4851 Cedar Springs Rd Unit 392
- 4859 Cedar Springs Rd Unit 234
- 4859 Cedar Springs Rd Unit 161I
- 4845 Cedar Springs Rd Unit 172R
- 4859 Cedar Springs Rd Unit 131F
- 4851 Cedar Springs Rd Unit 385N
- 4859 Cedar Springs Rd Unit 238H
- 4845 Cedar Springs Rd Unit 269Q
- 4845 Cedar Springs Rd Unit 264
- 4851 Cedar Springs Rd Unit 175L
- 4837 Cedar Springs Rd Unit 212
- 4845 Cedar Springs Rd Unit 270Q
- 4845 Cedar Springs Rd Unit 363
- 4859 Cedar Springs Rd Unit 244J
- 4845 Cedar Springs Rd Unit 266P
- 4845 Cedar Springs Rd Unit 263P