Estimated Value: $343,000 - $372,000
4
Beds
1
Bath
1,750
Sq Ft
$207/Sq Ft
Est. Value
About This Home
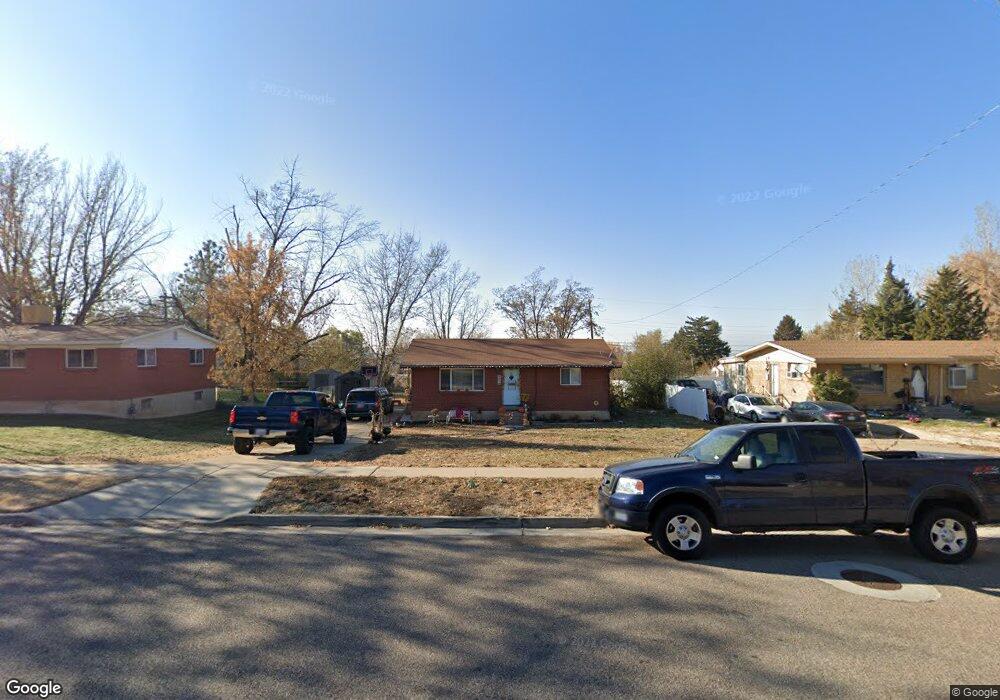
This home is located at 4851 S 2675 W Unit 20, Roy, UT 84067 and is currently estimated at $361,979, approximately $206 per square foot. 4851 S 2675 W Unit 20 is a home located in Weber County with nearby schools including Lakeview Elementary School, Roy Junior High School, and Roy High School.
Ownership History
Date
Name
Owned For
Owner Type
Purchase Details
Closed on
Jan 10, 2022
Sold by
Stalker Floyd B
Bought by
Dalebout Nathan
Current Estimated Value
Home Financials for this Owner
Home Financials are based on the most recent Mortgage that was taken out on this home.
Original Mortgage
$317,190
Outstanding Balance
$292,330
Interest Rate
3.11%
Mortgage Type
New Conventional
Estimated Equity
$69,649
Purchase Details
Closed on
Jun 13, 2005
Sold by
Stalker Floyd B
Bought by
Utah Transit Authority
Create a Home Valuation Report for This Property
The Home Valuation Report is an in-depth analysis detailing your home's value as well as a comparison with similar homes in the area
Home Values in the Area
Average Home Value in this Area
Purchase History
| Date | Buyer | Sale Price | Title Company |
|---|---|---|---|
| Dalebout Nathan | -- | Metro National Title | |
| Utah Transit Authority | -- | First American Title |
Source: Public Records
Mortgage History
| Date | Status | Borrower | Loan Amount |
|---|---|---|---|
| Open | Dalebout Nathan | $317,190 |
Source: Public Records
Tax History
| Year | Tax Paid | Tax Assessment Tax Assessment Total Assessment is a certain percentage of the fair market value that is determined by local assessors to be the total taxable value of land and additions on the property. | Land | Improvement |
|---|---|---|---|---|
| 2025 | $2,109 | $322,961 | $119,519 | $203,442 |
| 2024 | $2,062 | $174,900 | $65,736 | $109,164 |
| 2023 | $1,921 | $162,250 | $61,988 | $100,262 |
| 2022 | $2,190 | $194,150 | $53,322 | $140,828 |
| 2021 | $1,794 | $260,000 | $68,568 | $191,432 |
| 2020 | $1,543 | $203,000 | $68,568 | $134,432 |
| 2019 | $1,446 | $178,000 | $41,852 | $136,148 |
| 2018 | $1,257 | $143,000 | $37,969 | $105,031 |
| 2017 | $1,191 | $126,486 | $34,702 | $91,784 |
| 2016 | $1,133 | $64,442 | $16,856 | $47,586 |
| 2015 | $993 | $56,765 | $14,483 | $42,282 |
| 2014 | $983 | $55,620 | $14,483 | $41,137 |
Source: Public Records
Map
Nearby Homes
Your Personal Tour Guide
Ask me questions while you tour the home.