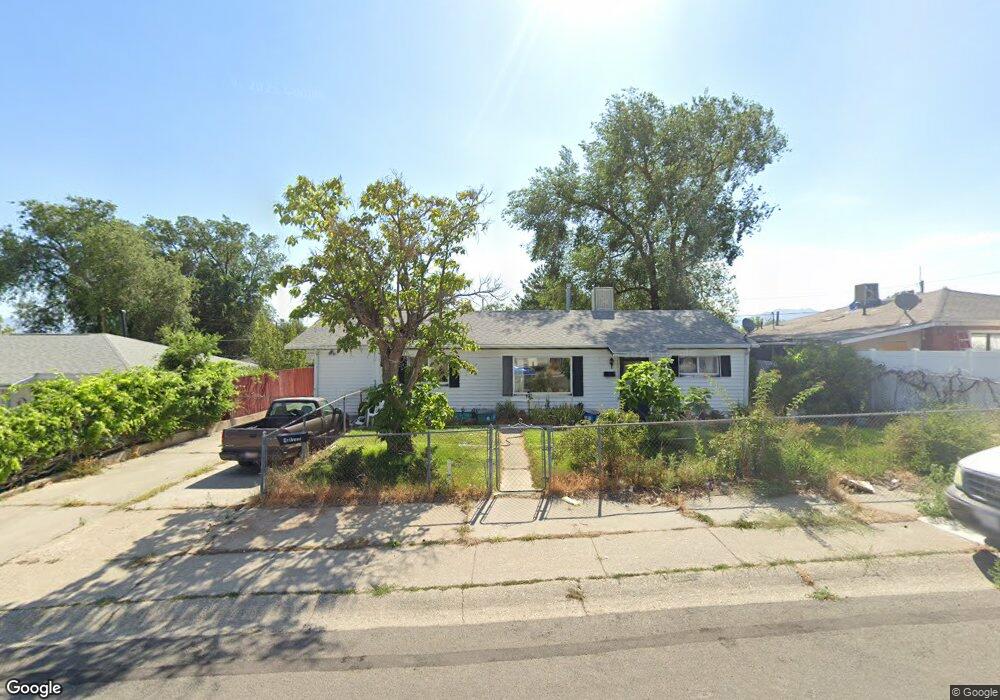
4851 S 4900 W Salt Lake City, UT 84118
Estimated Value: $395,141 - $412,000
4
Beds
2
Baths
1,440
Sq Ft
$279/Sq Ft
Est. Value
About This Home
This home is located at 4851 S 4900 W, Salt Lake City, UT 84118 and is currently estimated at $402,285, approximately $279 per square foot. 4851 S 4900 W is a home located in Salt Lake County with nearby schools including West Kearns Elementary School, Kearns Jr High School, and Kearns High School.
Ownership History
Date
Name
Owned For
Owner Type
Purchase Details
Closed on
Sep 27, 2007
Sold by
Mcomie Holdings Llc
Bought by
Dixon Wanda L
Current Estimated Value
Home Financials for this Owner
Home Financials are based on the most recent Mortgage that was taken out on this home.
Original Mortgage
$149,900
Outstanding Balance
$95,533
Interest Rate
6.61%
Mortgage Type
Purchase Money Mortgage
Estimated Equity
$306,752
Purchase Details
Closed on
Apr 4, 2007
Sold by
Mcomie Jarrod D
Bought by
Mcomie Holdings Llc
Purchase Details
Closed on
Apr 3, 2007
Sold by
Ete Eleele Sau
Bought by
Mcomie Jarrod D
Purchase Details
Closed on
Oct 28, 2005
Sold by
Endo Michael and Endo George T
Bought by
Ete Eleele Sau
Purchase Details
Closed on
Jul 31, 2002
Sold by
Endo George T
Bought by
Endo Michael and Endo George T
Purchase Details
Closed on
Aug 11, 1998
Sold by
Bradley Norman David and Bradley Fumiko E
Bought by
Endo George T
Create a Home Valuation Report for This Property
The Home Valuation Report is an in-depth analysis detailing your home's value as well as a comparison with similar homes in the area
Home Values in the Area
Average Home Value in this Area
Purchase History
| Date | Buyer | Sale Price | Title Company |
|---|---|---|---|
| Dixon Wanda L | -- | First American Title | |
| Mcomie Holdings Llc | -- | Accommodation | |
| Mcomie Jarrod D | -- | United Title Services | |
| Ete Eleele Sau | -- | Guardian Title | |
| Endo Michael | -- | Mountain View Title | |
| Endo George T | -- | -- |
Source: Public Records
Mortgage History
| Date | Status | Borrower | Loan Amount |
|---|---|---|---|
| Open | Dixon Wanda L | $149,900 |
Source: Public Records
Tax History Compared to Growth
Tax History
| Year | Tax Paid | Tax Assessment Tax Assessment Total Assessment is a certain percentage of the fair market value that is determined by local assessors to be the total taxable value of land and additions on the property. | Land | Improvement |
|---|---|---|---|---|
| 2025 | $2,418 | $340,800 | $88,200 | $252,600 |
| 2024 | $2,418 | $324,500 | $82,800 | $241,700 |
| 2023 | $2,240 | $288,700 | $79,600 | $209,100 |
| 2022 | $2,284 | $302,300 | $78,100 | $224,200 |
| 2021 | $2,095 | $251,000 | $60,100 | $190,900 |
| 2020 | $1,857 | $207,900 | $54,700 | $153,200 |
| 2019 | $1,847 | $204,600 | $51,600 | $153,000 |
| 2018 | $1,807 | $187,000 | $51,600 | $135,400 |
| 2017 | $1,494 | $162,000 | $51,600 | $110,400 |
| 2016 | $1,315 | $136,700 | $47,600 | $89,100 |
| 2015 | $1,233 | $112,300 | $58,000 | $54,300 |
| 2014 | $999 | $102,200 | $53,900 | $48,300 |
Source: Public Records
Map
Nearby Homes
- 4911 S 4980 W
- 5075 W 4700 S Unit 89
- 5075 W 4700 S Unit 114
- 5075 W 4700 S
- 5075 W 4700 S Unit 66
- 5075 W 4700 S Unit 76
- 4843 S 4720 W
- 4760 S 4680 W
- 4731 W 4955 S
- 4673 Carnegie Tech St
- 4749 W Arlington Park Dr
- 4644 S Carnegie Tech St Unit 4
- 4756 W 5055 S
- 4632 S Arlington Park Dr
- 4585 W 4895 S
- 4597 S Trojan Dr
- 5009 Tuscan St
- 4612 S Carnegie Tech St
- 4775 W 5100 S
- 4824 S 4520 W