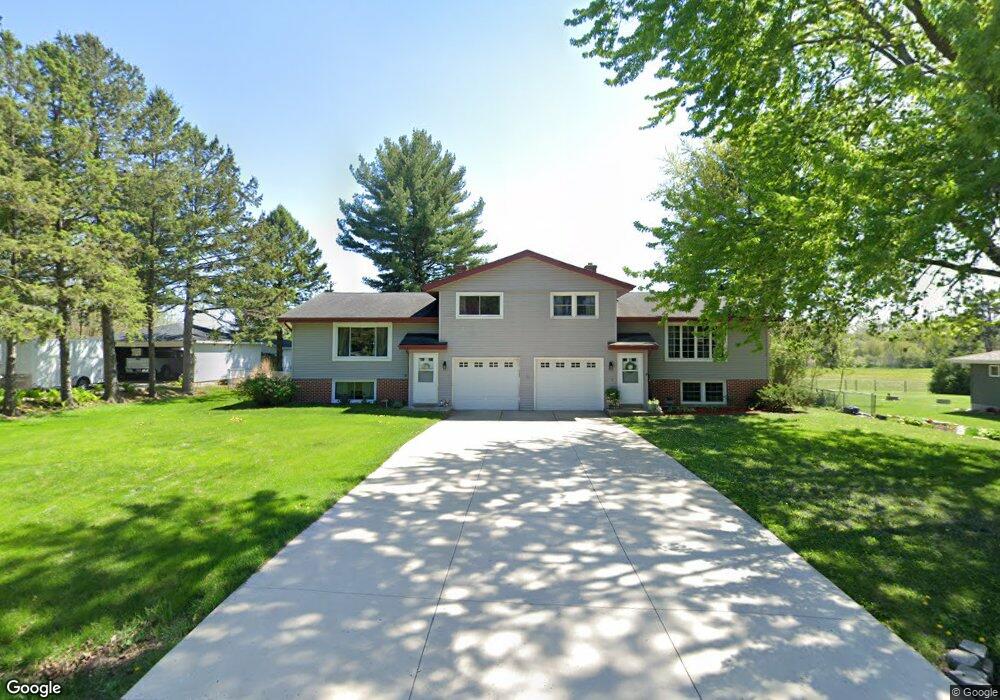
4853 Maple Ave Fitchburg, WI 53711
Estimated Value: $480,000 - $586,000
4
Beds
6
Baths
2,520
Sq Ft
$215/Sq Ft
Est. Value
About This Home
This home is located at 4853 Maple Ave, Fitchburg, WI 53711 and is currently estimated at $541,359, approximately $214 per square foot. 4853 Maple Ave is a home located in Dane County with nearby schools including Oregon Middle School, Rome Corners Intermediate School, and Oregon High School.
Ownership History
Date
Name
Owned For
Owner Type
Purchase Details
Closed on
Jul 29, 2013
Sold by
Jones & Jones Properties Llc
Bought by
Fuller Lucas N and Fuller Michele L
Current Estimated Value
Home Financials for this Owner
Home Financials are based on the most recent Mortgage that was taken out on this home.
Original Mortgage
$283,765
Outstanding Balance
$206,569
Interest Rate
3.87%
Mortgage Type
FHA
Estimated Equity
$334,790
Purchase Details
Closed on
Dec 12, 2006
Sold by
Brown Richard V
Bought by
Jones & Jones Properties Llc
Home Financials for this Owner
Home Financials are based on the most recent Mortgage that was taken out on this home.
Original Mortgage
$300,000
Interest Rate
6.36%
Mortgage Type
Purchase Money Mortgage
Purchase Details
Closed on
Oct 13, 2005
Sold by
Heil Gerhard E and Heil Mary Ann M
Bought by
Brown Richard V
Home Financials for this Owner
Home Financials are based on the most recent Mortgage that was taken out on this home.
Original Mortgage
$200,000
Interest Rate
6.37%
Mortgage Type
Adjustable Rate Mortgage/ARM
Create a Home Valuation Report for This Property
The Home Valuation Report is an in-depth analysis detailing your home's value as well as a comparison with similar homes in the area
Home Values in the Area
Average Home Value in this Area
Purchase History
| Date | Buyer | Sale Price | Title Company |
|---|---|---|---|
| Fuller Lucas N | $291,000 | None Available | |
| Jones & Jones Properties Llc | $255,000 | None Available | |
| Brown Richard V | $175,000 | None Available |
Source: Public Records
Mortgage History
| Date | Status | Borrower | Loan Amount |
|---|---|---|---|
| Open | Fuller Lucas N | $283,765 | |
| Previous Owner | Jones & Jones Properties Llc | $300,000 | |
| Previous Owner | Brown Richard V | $200,000 |
Source: Public Records
Tax History Compared to Growth
Tax History
| Year | Tax Paid | Tax Assessment Tax Assessment Total Assessment is a certain percentage of the fair market value that is determined by local assessors to be the total taxable value of land and additions on the property. | Land | Improvement |
|---|---|---|---|---|
| 2024 | $8,287 | $454,300 | $80,000 | $374,300 |
| 2023 | $7,739 | $374,800 | $80,000 | $294,800 |
| 2021 | $6,930 | $324,300 | $56,100 | $268,200 |
| 2020 | $6,631 | $324,300 | $56,100 | $268,200 |
| 2019 | $6,817 | $328,600 | $62,500 | $266,100 |
| 2018 | $6,976 | $315,600 | $62,500 | $253,100 |
| 2017 | $6,852 | $303,200 | $62,500 | $240,700 |
| 2016 | $6,833 | $292,800 | $62,500 | $230,300 |
| 2015 | $6,597 | $288,600 | $62,500 | $226,100 |
| 2014 | $6,604 | $288,700 | $62,500 | $226,200 |
| 2013 | $6,636 | $288,700 | $62,500 | $226,200 |
Source: Public Records
Map
Nearby Homes
- 2395 White Oak Trail
- 2257 S Syene Rd
- 2801 Frisee Dr
- 2818 Frisee Dr
- 4875 Arugula Rd
- 4812 Schneider Dr
- 5293 Fiddle St
- 5296 Athlone Rd
- 5298 Athlone Rd
- 4864 Romaine Rd
- 5223 Lacy Rd
- 5308 Athlone Rd
- 5305 Athlone Rd
- 5307 Athlone Rd
- 5313 Nobel Dr
- L364 Romaine Rd
- L363 Romaine Rd
- L366 Romaine Rd
- 5312 Athlone Rd
- 5309 Athlone Rd