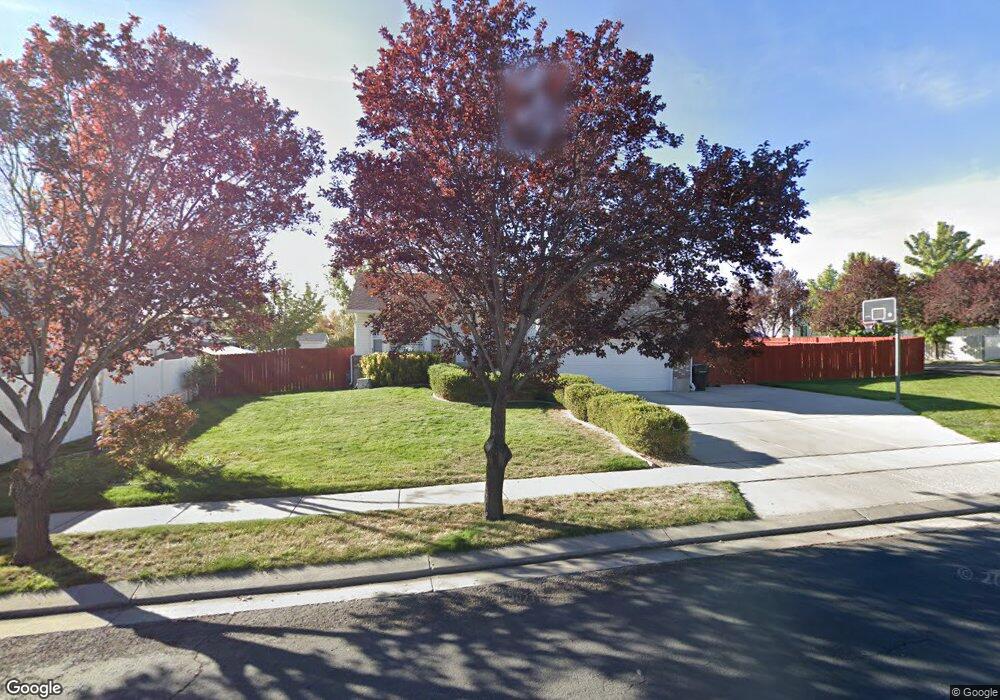
4853 W 8660 S West Jordan, UT 84081
Copper Hills NeighborhoodEstimated Value: $537,000 - $599,000
5
Beds
3
Baths
2,500
Sq Ft
$229/Sq Ft
Est. Value
About This Home
This home is located at 4853 W 8660 S, West Jordan, UT 84081 and is currently estimated at $573,138, approximately $229 per square foot. 4853 W 8660 S is a home located in Salt Lake County with nearby schools including Jordan Hills Elementary School, West Hills Middle School, and Copper Hills High School.
Ownership History
Date
Name
Owned For
Owner Type
Purchase Details
Closed on
Sep 11, 2020
Sold by
Monson Richard A and Monson Maryann
Bought by
Monson Richard A and Monson Maryann
Current Estimated Value
Purchase Details
Closed on
Jun 25, 1998
Sold by
Bracey Richard N and Bracey Kimberly A
Bought by
Monson Richard A and Monson Maryann
Home Financials for this Owner
Home Financials are based on the most recent Mortgage that was taken out on this home.
Original Mortgage
$136,700
Outstanding Balance
$27,371
Interest Rate
7.06%
Estimated Equity
$545,767
Purchase Details
Closed on
Oct 11, 1994
Sold by
Vallone Ron
Bought by
Bracey Richard N and Bracey Kimberly A
Home Financials for this Owner
Home Financials are based on the most recent Mortgage that was taken out on this home.
Original Mortgage
$95,500
Interest Rate
8.5%
Create a Home Valuation Report for This Property
The Home Valuation Report is an in-depth analysis detailing your home's value as well as a comparison with similar homes in the area
Home Values in the Area
Average Home Value in this Area
Purchase History
| Date | Buyer | Sale Price | Title Company |
|---|---|---|---|
| Monson Richard A | -- | None Available | |
| Monson Richard A | -- | First American Title | |
| Bracey Richard N | -- | -- |
Source: Public Records
Mortgage History
| Date | Status | Borrower | Loan Amount |
|---|---|---|---|
| Open | Monson Richard A | $136,700 | |
| Previous Owner | Bracey Richard N | $95,500 |
Source: Public Records
Tax History Compared to Growth
Tax History
| Year | Tax Paid | Tax Assessment Tax Assessment Total Assessment is a certain percentage of the fair market value that is determined by local assessors to be the total taxable value of land and additions on the property. | Land | Improvement |
|---|---|---|---|---|
| 2025 | $2,720 | $529,300 | $176,200 | $353,100 |
| 2024 | $2,720 | $523,400 | $174,500 | $348,900 |
| 2023 | $2,748 | $498,300 | $164,600 | $333,700 |
| 2022 | $2,605 | $464,800 | $161,400 | $303,400 |
| 2021 | $2,195 | $356,500 | $125,400 | $231,100 |
| 2020 | $2,051 | $312,600 | $125,400 | $187,200 |
| 2019 | $2,015 | $301,100 | $118,400 | $182,700 |
| 2018 | $1,896 | $281,100 | $118,400 | $162,700 |
| 2017 | $1,765 | $260,500 | $118,400 | $142,100 |
| 2016 | $1,689 | $234,200 | $118,400 | $115,800 |
| 2015 | $1,818 | $245,800 | $125,100 | $120,700 |
| 2014 | $1,683 | $224,000 | $115,000 | $109,000 |
Source: Public Records
Map
Nearby Homes
- 4887 W 8620 S
- 8577 Autumn Gold Cir
- 4624 Pine Crossing Dr
- 7903 Mckenzie Ln
- 7886 Mckenzie Ln
- 5098 Cherry Laurel Ln
- 8322 Copper Vista Cir
- 8359 Etude Dr
- 8441 S Spratling Dr
- 8854 Rocky Creek Dr
- 8453 S Windmill Dr
- 4904 Wild Acres Dr
- 9118 S Wisteria Way
- 8941 S Sun Leaf Dr
- 4707 W Granada Hills Ct
- 9182 Wisteria Way
- 9332 S Wild Clover Ln
- 8767 S Brown Park Dr
- 5582 Washoe Cove
- 4678 Emmons Dr