Estimated Value: $362,000 - $413,000
4
Beds
2
Baths
1,758
Sq Ft
$223/Sq Ft
Est. Value
About This Home
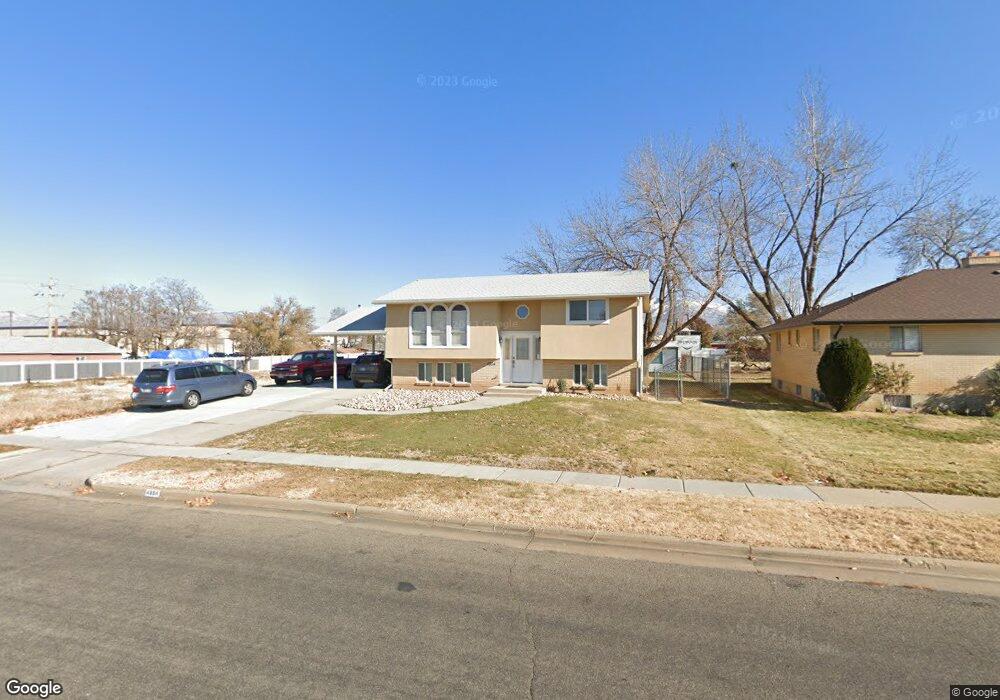
This home is located at 4854 S 2275 W, Roy, UT 84067 and is currently estimated at $392,846, approximately $223 per square foot. 4854 S 2275 W is a home located in Weber County with nearby schools including Lakeview Elementary School, Roy Junior High School, and Roy High School.
Ownership History
Date
Name
Owned For
Owner Type
Purchase Details
Closed on
Feb 20, 2019
Sold by
Harvey Tanner and Harvey Kalyn
Bought by
Cortes Alfredo Gomez and Hernandez Ma Teresa Nunez
Current Estimated Value
Purchase Details
Closed on
Apr 13, 2016
Bought by
Harvey Tanner
Home Financials for this Owner
Home Financials are based on the most recent Mortgage that was taken out on this home.
Original Mortgage
$164,900
Interest Rate
3.59%
Purchase Details
Closed on
Mar 23, 2000
Sold by
Jonkman John
Bought by
Thomas Dennis and Thomas Ann B
Home Financials for this Owner
Home Financials are based on the most recent Mortgage that was taken out on this home.
Original Mortgage
$110,500
Interest Rate
8.38%
Purchase Details
Closed on
May 30, 1997
Sold by
Anderson Daniel W
Bought by
Jonkman John
Create a Home Valuation Report for This Property
The Home Valuation Report is an in-depth analysis detailing your home's value as well as a comparison with similar homes in the area
Home Values in the Area
Average Home Value in this Area
Purchase History
| Date | Buyer | Sale Price | Title Company |
|---|---|---|---|
| Cortes Alfredo Gomez | -- | Intermountain Title Ins & E | |
| Harvey Tanner | -- | -- | |
| Thomas Dennis | -- | Backman Stewart Title | |
| Jonkman John | $77,500 | -- |
Source: Public Records
Mortgage History
| Date | Status | Borrower | Loan Amount |
|---|---|---|---|
| Previous Owner | Harvey Tanner | $164,900 | |
| Previous Owner | Harvey Tanner | -- | |
| Previous Owner | Thomas Dennis | $110,500 |
Source: Public Records
Tax History Compared to Growth
Tax History
| Year | Tax Paid | Tax Assessment Tax Assessment Total Assessment is a certain percentage of the fair market value that is determined by local assessors to be the total taxable value of land and additions on the property. | Land | Improvement |
|---|---|---|---|---|
| 2025 | $2,227 | $344,840 | $121,338 | $223,502 |
| 2024 | $2,123 | $181,499 | $66,736 | $114,763 |
| 2023 | $2,100 | $180,401 | $63,707 | $116,694 |
| 2022 | $2,348 | $210,650 | $58,207 | $152,443 |
| 2021 | $1,896 | $278,000 | $70,585 | $207,415 |
| 2020 | $1,663 | $222,000 | $70,585 | $151,415 |
| 2019 | $1,636 | $206,000 | $40,517 | $165,483 |
| 2018 | $1,445 | $169,000 | $37,469 | $131,531 |
| 2017 | $1,325 | $144,000 | $37,469 | $106,531 |
| 2016 | $1,322 | $77,696 | $19,164 | $58,532 |
| 2015 | $1,163 | $69,019 | $19,164 | $49,855 |
| 2014 | $1,141 | $66,828 | $16,299 | $50,529 |
Source: Public Records
Map
Nearby Homes