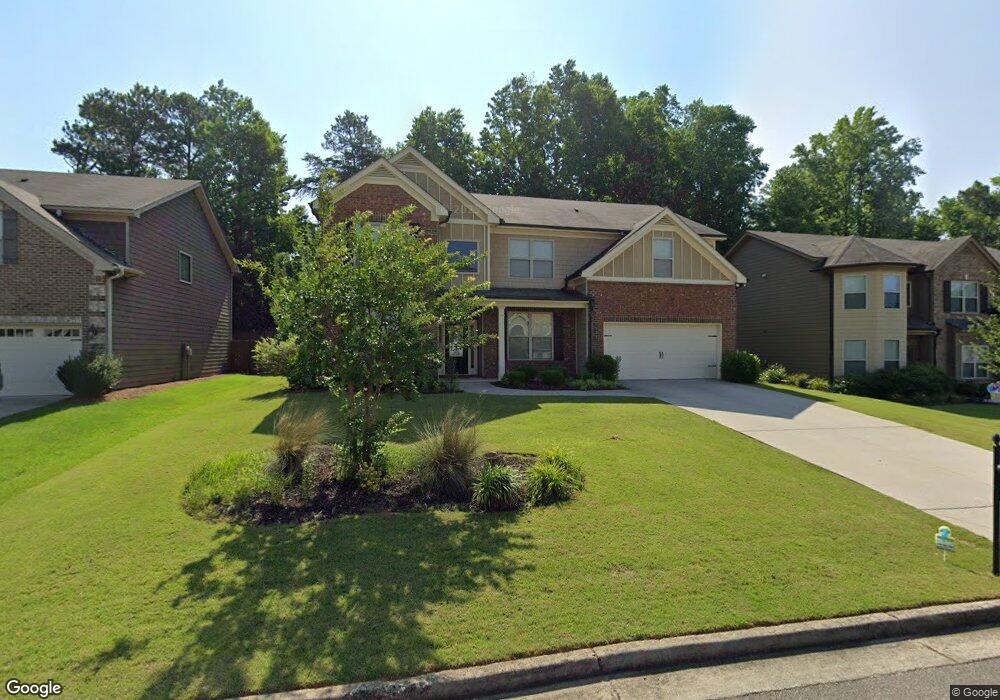
4855 Haysboro Way Unit 67A Cumming, GA 30040
Estimated Value: $553,000 - $637,000
5
Beds
3
Baths
3,346
Sq Ft
$175/Sq Ft
Est. Value
About This Home
This home is located at 4855 Haysboro Way Unit 67A, Cumming, GA 30040 and is currently estimated at $584,813, approximately $174 per square foot. 4855 Haysboro Way Unit 67A is a home located in Forsyth County with nearby schools including Coal Mountain Elementary School, North Forsyth Middle School, and North Forsyth High School.
Ownership History
Date
Name
Owned For
Owner Type
Purchase Details
Closed on
Mar 12, 2021
Sold by
Maziane Mohamed Amine
Bought by
Maziane Mohamed Amine and Fadil Sanabil
Current Estimated Value
Home Financials for this Owner
Home Financials are based on the most recent Mortgage that was taken out on this home.
Original Mortgage
$355,000
Outstanding Balance
$318,394
Interest Rate
2.73%
Mortgage Type
New Conventional
Estimated Equity
$266,419
Purchase Details
Closed on
Dec 29, 2014
Sold by
Almont Homes Ne Inc
Bought by
Talbot James S and Talbot Kattia
Purchase Details
Closed on
Dec 12, 2014
Sold by
Reo Funding Solutions Iii Llc
Bought by
Almont Homes Ne Inc
Purchase Details
Closed on
Sep 12, 2012
Sold by
Brand Banking Co
Bought by
Reo Funding Solutions Iii Llc
Purchase Details
Closed on
Jul 6, 2010
Sold by
Tax Commissioner Of Forsyth Co
Bought by
Brand Banking Co
Create a Home Valuation Report for This Property
The Home Valuation Report is an in-depth analysis detailing your home's value as well as a comparison with similar homes in the area
Home Values in the Area
Average Home Value in this Area
Purchase History
| Date | Buyer | Sale Price | Title Company |
|---|---|---|---|
| Maziane Mohamed Amine | $375,000 | -- | |
| Maziane Mohamed Amine | $375,000 | -- | |
| Talbot James S | $262,000 | -- | |
| Almont Homes Ne Inc | $50,000 | -- | |
| Reo Funding Solutions Iii Llc | $930,000 | -- | |
| Brand Banking Co | $2,400 | -- |
Source: Public Records
Mortgage History
| Date | Status | Borrower | Loan Amount |
|---|---|---|---|
| Open | Maziane Mohamed Amine | $355,000 | |
| Closed | Maziane Mohamed Amine | $355,000 |
Source: Public Records
Tax History Compared to Growth
Tax History
| Year | Tax Paid | Tax Assessment Tax Assessment Total Assessment is a certain percentage of the fair market value that is determined by local assessors to be the total taxable value of land and additions on the property. | Land | Improvement |
|---|---|---|---|---|
| 2025 | $4,794 | $223,256 | $56,000 | $167,256 |
| 2024 | $4,794 | $223,648 | $54,000 | $169,648 |
| 2023 | $4,360 | $218,952 | $40,000 | $178,952 |
| 2022 | $3,840 | $135,180 | $30,000 | $105,180 |
| 2021 | $3,733 | $135,180 | $30,000 | $105,180 |
| 2020 | $3,551 | $128,596 | $24,000 | $104,596 |
| 2019 | $3,499 | $126,532 | $24,000 | $102,532 |
| 2018 | $3,560 | $128,748 | $20,000 | $108,748 |
| 2017 | $3,365 | $121,248 | $20,000 | $101,248 |
| 2016 | $3,002 | $108,168 | $20,000 | $88,168 |
| 2015 | $2,764 | $99,408 | $20,000 | $79,408 |
| 2014 | $169 | $6,400 | $6,400 | $0 |
Source: Public Records
Map
Nearby Homes
- 4810 Haysboro Way
- 4085 Sierra Vista Cir
- 4120 Sierra Vista Cir
- 3810 Sierra Lake Dr
- 4420 Belcrest Way
- 3725 Sierra Lake Dr
- 3995 Sierra Lake Dr
- 4010 Sierra Knolls Ct
- 4020 Sierra Knolls Ct
- 3055 Spot Rd
- 4230 Jonathan Ln
- 3940 Twin Lakes Rd
- 3415 Spot Rd
- 2960 Bailey Dr
- 2955 Bailey Dr
- 6260 Dexters Dr
- 6255 Dana Way
- 6230 Dana Way
- 6445 Crystal Ln
- 6380 Lake Oak Landing
- 4855 Haysboro Way
- 4865 Haysboro Way
- 0 Haysboro Way Unit 8826580
- 4845 Haysboro Way Unit 68A
- 4845 Haysboro Way
- 4850 Haysboro Way
- 4860 Haysboro Way Unit 128
- 4860 Haysboro Way
- 4875 Haysboro Way Unit 65
- 4875 Haysboro Way
- 4835 Haysboro Way
- 4835 Haysboro Way Unit 69
- 4840 Haysboro Way
- 4870 Haysboro Way
- 4885 Haysboro Way
- 4830 Haysboro Way
- 4830 Haysboro Way Unit 131
- 4825 Haysboro Way
- 4825 Haysboro Way Unit 70
- 4895 Haysboro Way