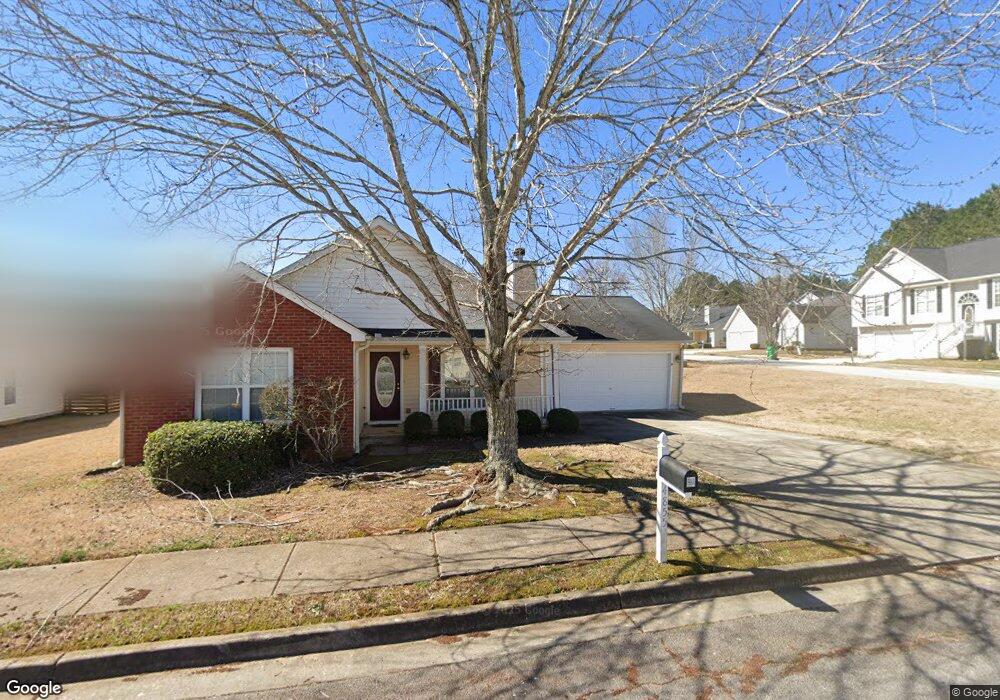
4855 Ozment Trail Unit 2 Lithonia, GA 30038
Estimated Value: $249,000 - $275,000
3
Beds
2
Baths
1,722
Sq Ft
$149/Sq Ft
Est. Value
About This Home
This home is located at 4855 Ozment Trail Unit 2, Lithonia, GA 30038 and is currently estimated at $256,043, approximately $148 per square foot. 4855 Ozment Trail Unit 2 is a home located in DeKalb County with nearby schools including Murphy Candler Elementary School, Salem Middle School, and Martin Luther King- Jr. High School.
Ownership History
Date
Name
Owned For
Owner Type
Purchase Details
Closed on
Nov 30, 2011
Sold by
Secretary Of Housing And U
Bought by
Burrell Lenora
Current Estimated Value
Home Financials for this Owner
Home Financials are based on the most recent Mortgage that was taken out on this home.
Original Mortgage
$46,925
Outstanding Balance
$33,217
Interest Rate
4.75%
Mortgage Type
FHA
Estimated Equity
$222,826
Purchase Details
Closed on
Dec 7, 2010
Sold by
Wells Fargo Bk Na
Bought by
Hud-Housing Of Urban Dev
Purchase Details
Closed on
Nov 7, 2006
Sold by
Ford Ashley
Bought by
Jp Morgan Chase Bk
Purchase Details
Closed on
Dec 31, 2003
Sold by
Knight Group Inc
Bought by
Ford Ashleyh
Home Financials for this Owner
Home Financials are based on the most recent Mortgage that was taken out on this home.
Original Mortgage
$132,823
Interest Rate
8.5%
Mortgage Type
New Conventional
Create a Home Valuation Report for This Property
The Home Valuation Report is an in-depth analysis detailing your home's value as well as a comparison with similar homes in the area
Home Values in the Area
Average Home Value in this Area
Purchase History
| Date | Buyer | Sale Price | Title Company |
|---|---|---|---|
| Burrell Lenora | $45,500 | -- | |
| Hud-Housing Of Urban Dev | -- | -- | |
| Wells Fargo Bk Na | $130,859 | -- | |
| Jp Morgan Chase Bk | $124,950 | -- | |
| Ford Ashleyh | $139,900 | -- |
Source: Public Records
Mortgage History
| Date | Status | Borrower | Loan Amount |
|---|---|---|---|
| Open | Burrell Lenora | $46,925 | |
| Previous Owner | Ford Ashleyh | $132,823 |
Source: Public Records
Tax History Compared to Growth
Tax History
| Year | Tax Paid | Tax Assessment Tax Assessment Total Assessment is a certain percentage of the fair market value that is determined by local assessors to be the total taxable value of land and additions on the property. | Land | Improvement |
|---|---|---|---|---|
| 2025 | $662 | $108,000 | $18,360 | $89,640 |
| 2024 | $2,859 | $105,800 | $18,000 | $87,800 |
| 2023 | $2,859 | $108,000 | $18,000 | $90,000 |
| 2022 | $2,327 | $87,000 | $10,000 | $77,000 |
| 2021 | $1,805 | $63,880 | $6,760 | $57,120 |
| 2020 | $1,578 | $54,320 | $6,760 | $47,560 |
| 2019 | $1,474 | $49,560 | $6,760 | $42,800 |
| 2018 | $1,235 | $45,680 | $6,760 | $38,920 |
| 2017 | $1,344 | $42,560 | $6,760 | $35,800 |
| 2016 | $1,156 | $35,480 | $6,760 | $28,720 |
| 2014 | $1,225 | $38,200 | $6,760 | $31,440 |
Source: Public Records
Map
Nearby Homes
- 4889 Ozment Ridge Ct
- 4895 Ozment Ridge Ct
- 5100 River Overlook Way
- 4708 Golod Way Unit 2
- 4934 Serena Ct
- 4753 Klondike Cove
- 5009 Lynnonhall Ct
- 6226 Leverett Dr
- 6205 Leverett Dr
- 6114 Leverett Dr
- 6084 Leverett Dr
- 6177 Idlewood Cir
- 4632 Garden City Dr
- 4408 Idlewood Park
- 5925 Idlewood Place
- 4701 Garden City Dr
- 4273 Chestnut Lake Ave
- 4716 Idlewood Gate
- 6468 Gina Agha Cir
- 4861 Ozment Trail
- 0 Ozment Tr
- 6474 Gina Agha Cir
- 4862 Ozment Trail
- 4867 Ozment Trail
- 0 Gina Agha Cir Unit 8700748
- 0 Gina Agha Cir Unit 8664025
- 0 Gina Agha Cir Unit 8487515
- 0 Gina Agha Cir Unit 8468560
- 0 Gina Agha Cir Unit 8425575
- 0 Gina Agha Cir Unit 3176004
- 0 Gina Agha Cir Unit 8105480
- 0 Gina Agha Cir Unit 8909246
- 0 Gina Agha Cir Unit 8619379
- 0 Gina Agha Cir Unit 8241648
- 0 Gina Agha Cir Unit 8035244
- 0 Gina Agha Cir Unit 7434663
- 0 Gina Agha Cir Unit 7357417
- 0 Gina Agha Cir Unit 7224494