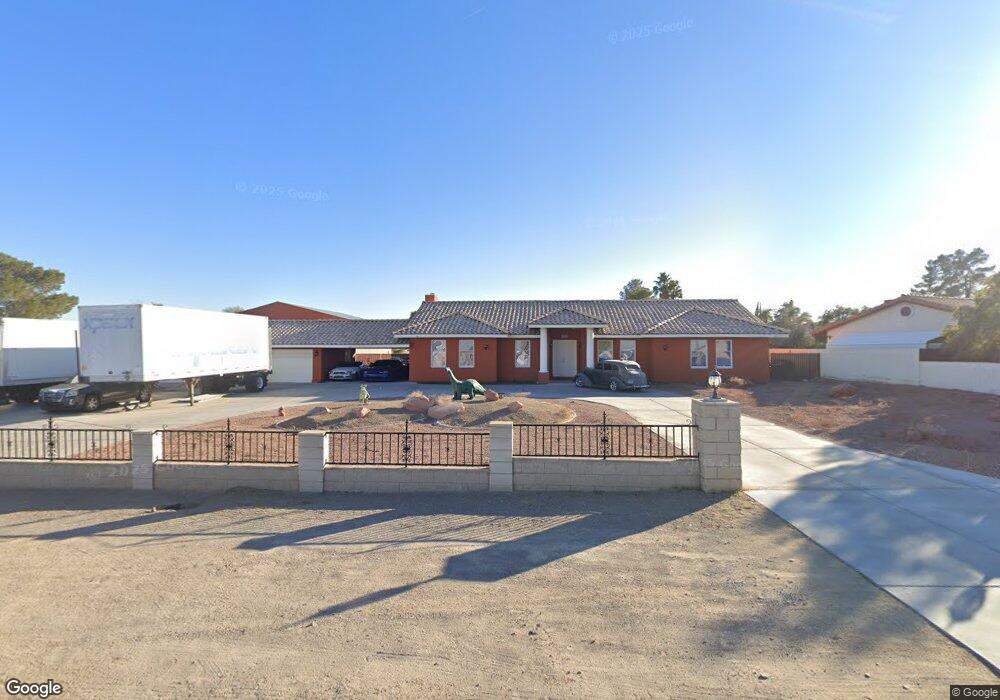
4855 W Maulding Ave Las Vegas, NV 89139
Coronado Ranch NeighborhoodEstimated Value: $809,000 - $988,000
3
Beds
3
Baths
2,910
Sq Ft
$300/Sq Ft
Est. Value
About This Home
This home is located at 4855 W Maulding Ave, Las Vegas, NV 89139 and is currently estimated at $873,291, approximately $300 per square foot. 4855 W Maulding Ave is a home located in Clark County with nearby schools including Dr. Beverly S. Mathis Elementary School, Lawrence & Heidi Canarelli Middle School, and Desert Oasis High School.
Ownership History
Date
Name
Owned For
Owner Type
Purchase Details
Closed on
Apr 7, 2016
Sold by
Cunningham Andrea
Bought by
Cunningham Michael A
Current Estimated Value
Purchase Details
Closed on
Jan 28, 2010
Sold by
Us Bank National Association
Bought by
Cunningham Michael A
Home Financials for this Owner
Home Financials are based on the most recent Mortgage that was taken out on this home.
Original Mortgage
$225,834
Outstanding Balance
$151,100
Interest Rate
5.25%
Mortgage Type
FHA
Estimated Equity
$722,191
Purchase Details
Closed on
Oct 6, 2008
Sold by
Rebbeck Chris H
Bought by
Us Bank Na
Purchase Details
Closed on
Mar 5, 2008
Sold by
Rebbeck Chris H
Bought by
Hsbc Bank Usa Na and Holders Of The Ace Securities Corp Home
Purchase Details
Closed on
May 12, 2006
Sold by
Rebbeck Chris H and Rebbeck Patricia
Bought by
Rebbeck Chris H
Purchase Details
Closed on
Feb 25, 2000
Sold by
Harrison Christopher G and Rogers Dana
Bought by
Rebbeck Chris H and Rebbeck Patricia
Home Financials for this Owner
Home Financials are based on the most recent Mortgage that was taken out on this home.
Original Mortgage
$267,500
Interest Rate
9.25%
Create a Home Valuation Report for This Property
The Home Valuation Report is an in-depth analysis detailing your home's value as well as a comparison with similar homes in the area
Home Values in the Area
Average Home Value in this Area
Purchase History
| Date | Buyer | Sale Price | Title Company |
|---|---|---|---|
| Cunningham Michael A | -- | First American Title Insura | |
| Cunningham Michael A | $230,000 | Fidelity National Title Las | |
| Us Bank Na | $542,302 | Fidelity National | |
| Hsbc Bank Usa Na | $542,302 | Fidelity National Default So | |
| Rebbeck Chris H | -- | Accommodation | |
| Rebbeck Chris H | $294,000 | Old Republic Title Company |
Source: Public Records
Mortgage History
| Date | Status | Borrower | Loan Amount |
|---|---|---|---|
| Open | Cunningham Michael A | $225,834 | |
| Previous Owner | Rebbeck Chris H | $267,500 |
Source: Public Records
Tax History Compared to Growth
Tax History
| Year | Tax Paid | Tax Assessment Tax Assessment Total Assessment is a certain percentage of the fair market value that is determined by local assessors to be the total taxable value of land and additions on the property. | Land | Improvement |
|---|---|---|---|---|
| 2025 | $3,963 | $217,296 | $70,000 | $147,296 |
| 2024 | $3,848 | $217,296 | $70,000 | $147,296 |
| 2023 | $3,848 | $200,052 | $61,250 | $138,802 |
| 2022 | $3,736 | $182,419 | $54,250 | $128,169 |
| 2021 | $3,627 | $171,081 | $49,000 | $122,081 |
| 2020 | $3,519 | $170,127 | $49,000 | $121,127 |
| 2019 | $3,416 | $163,514 | $43,750 | $119,764 |
| 2018 | $3,317 | $151,462 | $35,000 | $116,462 |
| 2017 | $4,257 | $145,136 | $26,250 | $118,886 |
| 2016 | $3,140 | $138,551 | $26,250 | $112,301 |
| 2015 | $3,200 | $113,389 | $21,000 | $92,389 |
| 2014 | $3,103 | $127,755 | $15,750 | $112,005 |
Source: Public Records
Map
Nearby Homes
- 4930 W Maulding Ave
- 4998 Lavaliere Ave
- 7477 Ullom Dr
- 7682 Rafter Ct
- 7689 Black River St
- 7514 Rogers St
- 7850 Flagler St Unit 2
- 7446 Innovation Peak Ct
- 7445 Innovation Peak Ct
- 7415 Innovation Peak Ct
- 7923 Homer Ct
- 4732 Lone Grove Dr
- 4832 Englewood Ave
- 5419 Floating Flower Ave
- 5359 Montauck Ave
- 4536 W Warm Springs Rd
- 4315 W Maulding Ave
- 7215 Ullom Dr
- 5481 Railroad River Ave
- 5431 Hasley Canyon Ave
- 4885 W Maulding Ave
- 7645 Ullom Dr
- 7640 S Decatur Blvd
- 4844 W Maulding Ave
- 7580 S Decatur Blvd
- 4864 W Maulding Ave
- 4820 W Robindale Rd
- 7665 Ullom Dr
- 7660 S Decatur Blvd
- 7614 Ambersnail St
- 7608 Ambersnail St
- 7620 Ambersnail St
- 7620 S Ambersnail St
- 4725 W Maulding Ave
- 4725 W Maulding Ave
- 7626 Ambersnail St
- 7632 Ambersnail St
- 4910 W Maulding Ave
- 7500 Ullom Dr
- 7638 Ambersnail St