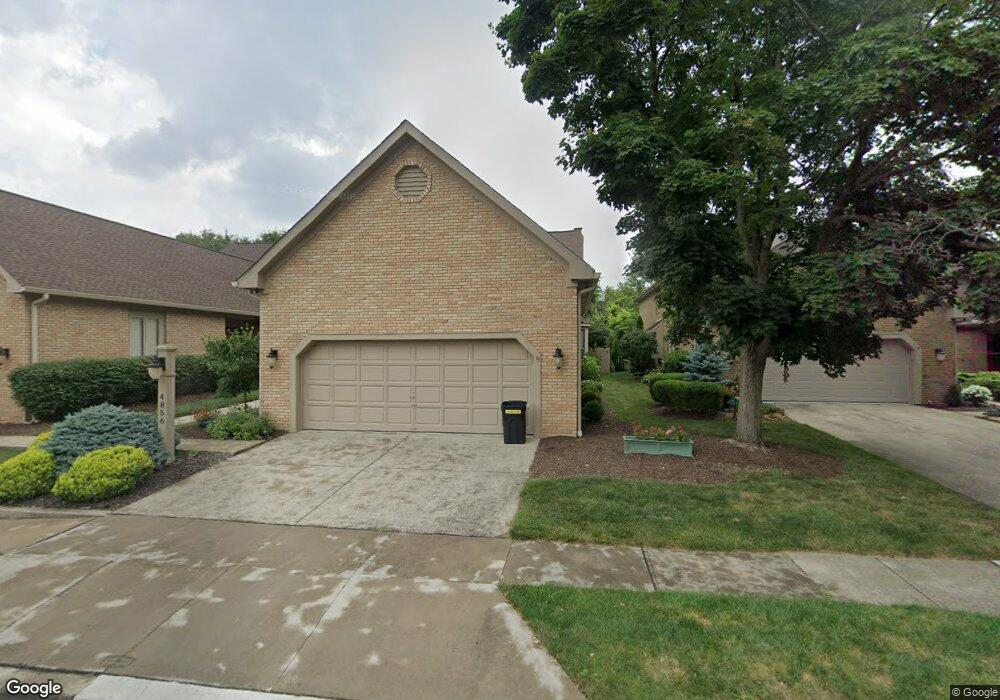
4856 Shackelford Ct Columbus, OH 43220
Estimated Value: $557,000 - $628,000
3
Beds
4
Baths
2,843
Sq Ft
$206/Sq Ft
Est. Value
About This Home
This home is located at 4856 Shackelford Ct, Columbus, OH 43220 and is currently estimated at $585,283, approximately $205 per square foot. 4856 Shackelford Ct is a home located in Franklin County with nearby schools including Greensview Elementary School, Hastings Middle School, and Upper Arlington High School.
Ownership History
Date
Name
Owned For
Owner Type
Purchase Details
Closed on
Jun 19, 2020
Sold by
Dewar Juli E and Sandra L Eckelberry Trust
Bought by
Staton Annalicia
Current Estimated Value
Home Financials for this Owner
Home Financials are based on the most recent Mortgage that was taken out on this home.
Original Mortgage
$338,400
Outstanding Balance
$237,893
Interest Rate
3.2%
Mortgage Type
New Conventional
Estimated Equity
$347,390
Purchase Details
Closed on
Feb 3, 2009
Sold by
Eckelberry Sandra L
Bought by
Eckelberry Sandra L and Sandra L Eckelberry Trust
Purchase Details
Closed on
Nov 1, 1996
Sold by
Davis Douglas
Bought by
Sandra L Eckelberry
Purchase Details
Closed on
Oct 16, 1996
Sold by
Falter Richard L
Bought by
Davis Douglas and Davis James
Purchase Details
Closed on
Jun 14, 1988
Create a Home Valuation Report for This Property
The Home Valuation Report is an in-depth analysis detailing your home's value as well as a comparison with similar homes in the area
Home Values in the Area
Average Home Value in this Area
Purchase History
| Date | Buyer | Sale Price | Title Company |
|---|---|---|---|
| Staton Annalicia | $376,000 | None Available | |
| Eckelberry Sandra L | -- | Attorney | |
| Sandra L Eckelberry | $240,000 | -- | |
| Davis Douglas | $250,000 | -- | |
| -- | $239,300 | -- |
Source: Public Records
Mortgage History
| Date | Status | Borrower | Loan Amount |
|---|---|---|---|
| Open | Staton Annalicia | $338,400 |
Source: Public Records
Tax History Compared to Growth
Tax History
| Year | Tax Paid | Tax Assessment Tax Assessment Total Assessment is a certain percentage of the fair market value that is determined by local assessors to be the total taxable value of land and additions on the property. | Land | Improvement |
|---|---|---|---|---|
| 2024 | $9,244 | $159,670 | $12,250 | $147,420 |
| 2023 | $9,129 | $159,670 | $12,250 | $147,420 |
| 2022 | $10,737 | $153,650 | $21,000 | $132,650 |
| 2021 | $9,504 | $153,650 | $21,000 | $132,650 |
| 2020 | $9,420 | $153,650 | $21,000 | $132,650 |
| 2019 | $8,878 | $128,030 | $17,500 | $110,530 |
| 2018 | $8,169 | $128,030 | $17,500 | $110,530 |
| 2017 | $8,163 | $128,030 | $17,500 | $110,530 |
| 2016 | $7,516 | $122,430 | $20,860 | $101,570 |
| 2015 | $7,510 | $122,430 | $20,860 | $101,570 |
| 2014 | $7,518 | $122,430 | $20,860 | $101,570 |
| 2013 | $3,747 | $116,620 | $19,880 | $96,740 |
Source: Public Records
Map
Nearby Homes
- 2165 Partlow Dr
- 2198 Sandston Rd
- 4781 Coach Rd
- 2231 Atlee Ct Unit 12
- 4861 Etrick Dr Unit 22
- 2248 Sandover Rd
- 2060 Fontenay Place
- 4740 Merrifield Place Unit 25
- 4720 Merrifield Place Unit 67
- 1865 Willoway Cir N Unit 1865
- 1835 Willoway Cir N
- 4450 Haverford Ct
- 5268 Captains Ct
- 1961 Ramble Branch Dr Unit 30
- 4924 Reed Rd Unit B
- 5000 Slate Run Woods Ct
- 2172 Hedgerow Rd Unit 2172G
- 5283 Ruthton Rd Unit 19
- 2560 Chartwell Rd
- 5244 Greensedge Way Unit 12
- 4856 Shackleford Ct
- 4860 Shackleford Ct
- 4850 Shackleford Ct
- 4846 Shackleford Ct Unit 4846
- 4846 Shackelford Ct
- 4870 Shackelford Ct
- 4870 Shackleford Ct
- 2139 Shackelford Ct
- 4836 Shackleford Ct
- 4853 Shackleford Ct Unit 4853
- 4849 Dierker Rd
- 4841 Dierker Rd
- 4830 Shackelford Ct
- 2147 Partlow Dr
- 4830 Shackleford Ct
- 4876 Shackleford Ct Unit 4876
- 4847 Dierker Rd
- 4826 Shackleford Ct
- 4826 Shackelford Ct
- 4880 Shackleford Ct Unit 4880