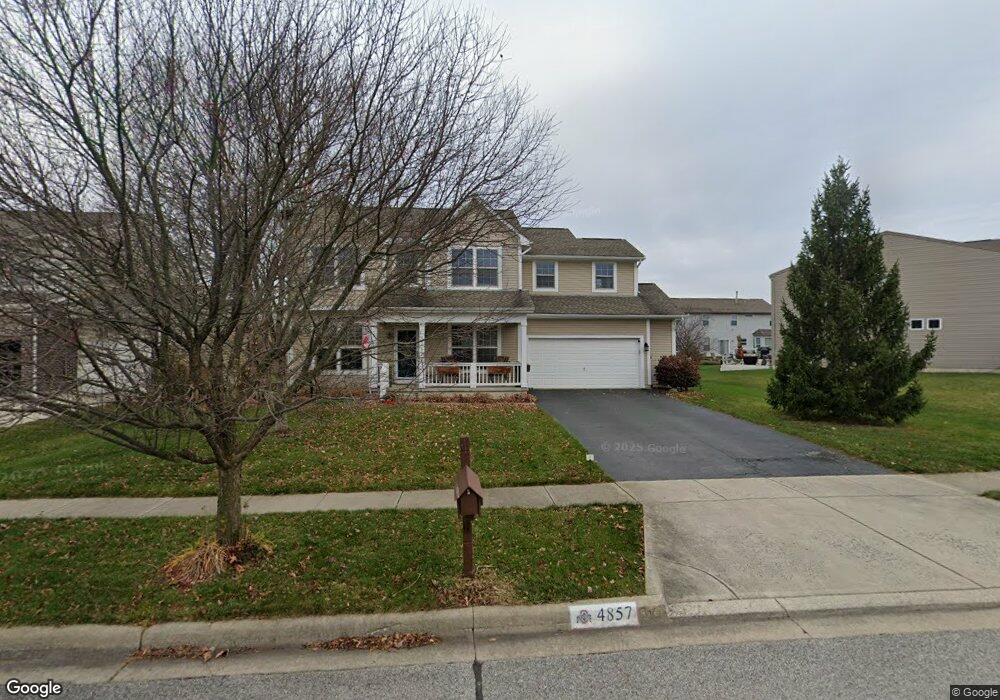
4857 Adwell Loop Grove City, OH 43123
Estimated Value: $417,721 - $512,000
4
Beds
3
Baths
2,827
Sq Ft
$167/Sq Ft
Est. Value
About This Home
This home is located at 4857 Adwell Loop, Grove City, OH 43123 and is currently estimated at $471,180, approximately $166 per square foot. 4857 Adwell Loop is a home located in Franklin County with nearby schools including Hayes Intermediate School, Jc Sommer Elementary School, and Jackson Middle School.
Ownership History
Date
Name
Owned For
Owner Type
Purchase Details
Closed on
Nov 29, 2013
Sold by
Skaggs Donald R and Skaggs Susan L
Bought by
Neal Jeffrey A O and Neal Amy M O
Current Estimated Value
Home Financials for this Owner
Home Financials are based on the most recent Mortgage that was taken out on this home.
Original Mortgage
$170,200
Interest Rate
4.04%
Mortgage Type
New Conventional
Purchase Details
Closed on
Apr 15, 2005
Sold by
Centex Homes
Bought by
Bellaire Prescott J and Bellaire Lynne A
Home Financials for this Owner
Home Financials are based on the most recent Mortgage that was taken out on this home.
Original Mortgage
$100,000
Interest Rate
6.06%
Mortgage Type
Purchase Money Mortgage
Purchase Details
Closed on
Mar 25, 2004
Sold by
Andrews Terry E
Bought by
Centex Homes
Create a Home Valuation Report for This Property
The Home Valuation Report is an in-depth analysis detailing your home's value as well as a comparison with similar homes in the area
Home Values in the Area
Average Home Value in this Area
Purchase History
| Date | Buyer | Sale Price | Title Company |
|---|---|---|---|
| Neal Jeffrey A O | $205,000 | None Available | |
| Bellaire Prescott J | $281,000 | Commerce Title | |
| Centex Homes | -- | -- | |
| Andrews Terry E | -- | -- |
Source: Public Records
Mortgage History
| Date | Status | Borrower | Loan Amount |
|---|---|---|---|
| Previous Owner | Neal Jeffrey A O | $170,200 | |
| Previous Owner | Bellaire Prescott J | $100,000 |
Source: Public Records
Tax History Compared to Growth
Tax History
| Year | Tax Paid | Tax Assessment Tax Assessment Total Assessment is a certain percentage of the fair market value that is determined by local assessors to be the total taxable value of land and additions on the property. | Land | Improvement |
|---|---|---|---|---|
| 2024 | $4,974 | $109,380 | $33,780 | $75,600 |
| 2023 | $4,904 | $109,375 | $33,775 | $75,600 |
| 2022 | $5,913 | $96,960 | $17,680 | $79,280 |
| 2021 | $6,027 | $96,960 | $17,680 | $79,280 |
| 2020 | $6,007 | $96,960 | $17,680 | $79,280 |
| 2019 | $5,377 | $80,510 | $14,740 | $65,770 |
| 2018 | $5,176 | $80,510 | $14,740 | $65,770 |
| 2017 | $5,165 | $80,510 | $14,740 | $65,770 |
| 2016 | $4,993 | $68,890 | $12,430 | $56,460 |
| 2015 | $4,995 | $68,890 | $12,430 | $56,460 |
| 2014 | $4,998 | $68,890 | $12,430 | $56,460 |
| 2013 | $4,492 | $65,590 | $11,830 | $53,760 |
Source: Public Records
Map
Nearby Homes
- 3022 Crabapple Place Unit 4
- 3240 Belstead Dr Unit 3240
- 4879 Blossom Way Unit 41
- 4793 Woodside Dr Unit 56
- 3575 Artberry Way Unit 42
- 3057 Mckinney Rd
- 4861 Citation Ct
- 3215 Farmhouse Ln
- 4517 Clayburn Dr W
- 3030 Darby Downs Rd
- 3022 Darby Downs Rd
- 3549 Whirla Way
- 5166 Southern Grove Dr
- 3207 Farmhouse Ln
- 3540 Whirla Way
- 3041 Mckinney Rd
- 2720 Loris Way
- 5124 Keefer Ln
- 2642 Gardenview Loop
- 2624 Gardenview Loop
- 4867 Adwell Loop
- 4867 Adwell Loop Unit 18
- 4833 Adwell Loop
- 4833 Adwell Loop Unit 20
- 4854 Backworth Dr
- 4877 Adwell Loop
- 4844 Backworth Dr
- 3120 Adderbury Dr
- 4874 Backworth Dr
- 4848 Adwell Loop
- 4887 Adwell Loop
- 4884 Backworth Dr
- 3108 Adderbury Dr
- 3117 Adderbury Dr
- 4818 Adwell Loop
- 3180 Guffey Dr
- 4808 Adwell Loop
- 4828 Adwell Loop
- 4783 Adwell Loop