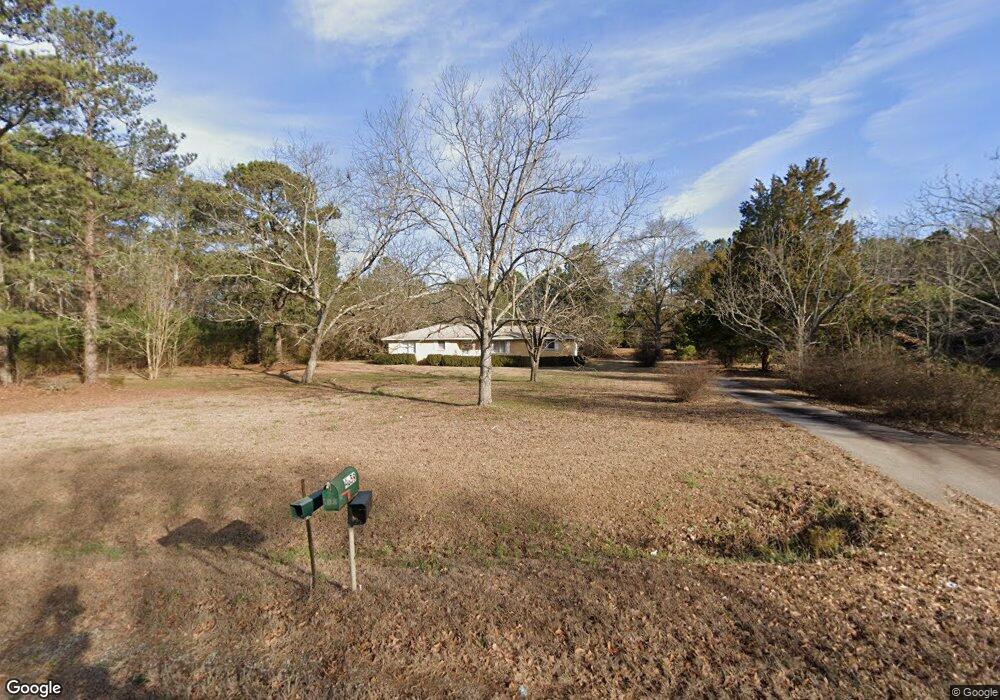
4859 Jersey Walnut Grove Rd Covington, GA 30014
Walnut Grove NeighborhoodEstimated Value: $256,000 - $341,000
--
Bed
--
Bath
1,706
Sq Ft
$175/Sq Ft
Est. Value
About This Home
This home is located at 4859 Jersey Walnut Grove Rd, Covington, GA 30014 and is currently estimated at $298,348, approximately $174 per square foot. 4859 Jersey Walnut Grove Rd is a home located in Walton County with nearby schools including Walnut Grove Elementary School, Youth Middle School, and Walnut Grove High School.
Ownership History
Date
Name
Owned For
Owner Type
Purchase Details
Closed on
Mar 29, 2024
Sold by
Kaler Robert
Bought by
Allgood Hudson
Current Estimated Value
Home Financials for this Owner
Home Financials are based on the most recent Mortgage that was taken out on this home.
Original Mortgage
$239,957
Outstanding Balance
$236,412
Interest Rate
6.94%
Mortgage Type
New Conventional
Estimated Equity
$61,936
Purchase Details
Closed on
Mar 1, 2016
Sold by
Kaler Robert
Bought by
Kaler Robert and Kaler Tina
Purchase Details
Closed on
Feb 22, 2016
Sold by
Kaler Tina
Bought by
Kaler Robert
Purchase Details
Closed on
Nov 13, 2012
Sold by
Smith Johnnie W
Bought by
Kaler Tina
Purchase Details
Closed on
Jun 9, 1995
Sold by
Bailey James Mary
Bought by
Smith Johnnie Rebecca
Create a Home Valuation Report for This Property
The Home Valuation Report is an in-depth analysis detailing your home's value as well as a comparison with similar homes in the area
Home Values in the Area
Average Home Value in this Area
Purchase History
| Date | Buyer | Sale Price | Title Company |
|---|---|---|---|
| Allgood Hudson | $214,000 | -- | |
| Kaler Robert | -- | -- | |
| Kaler Robert | -- | -- | |
| Kaler Tina | -- | -- | |
| Smith Johnnie Rebecca | $85,000 | -- |
Source: Public Records
Mortgage History
| Date | Status | Borrower | Loan Amount |
|---|---|---|---|
| Open | Allgood Hudson | $239,957 | |
| Closed | Smith Johnnie Rebecca | $0 |
Source: Public Records
Tax History Compared to Growth
Tax History
| Year | Tax Paid | Tax Assessment Tax Assessment Total Assessment is a certain percentage of the fair market value that is determined by local assessors to be the total taxable value of land and additions on the property. | Land | Improvement |
|---|---|---|---|---|
| 2024 | $2,385 | $80,908 | $31,200 | $49,708 |
| 2023 | $2,277 | $75,068 | $26,400 | $48,668 |
| 2022 | $2,116 | $66,908 | $23,600 | $43,308 |
| 2021 | $1,848 | $56,708 | $18,360 | $38,348 |
| 2020 | $1,790 | $53,588 | $15,920 | $37,668 |
| 2019 | $1,690 | $49,748 | $14,160 | $35,588 |
| 2018 | $1,664 | $49,748 | $14,160 | $35,588 |
| 2017 | $1,682 | $48,828 | $14,160 | $34,668 |
| 2016 | $1,366 | $40,228 | $10,080 | $30,148 |
| 2015 | $1,282 | $37,148 | $10,080 | $27,068 |
| 2014 | $1,216 | $34,372 | $9,600 | $24,772 |
Source: Public Records
Map
Nearby Homes
- 1610 Olympic Cir
- 1620 Olympic Cir
- 392 Hightower Ridge Rd
- 233 Elm St
- 466 Hwy 81
- 96 Highway 81
- 63 Paul Smith Rd Unit 2
- 63 Paul Smith Rd
- 75 Paul Smith Rd
- 2071 Habersham Cir
- 5430 Hightower Trail SE
- 5380 Fletcher Dr
- 152 Geoffrey Ln
- 5379 Fletcher Dr SW
- 73 Paul Smith Rd
- 550 Oak Ridge Dr SE
- 1760 Highway 138
- 5407 Wapakonata Trail SW
- 620 Creekside Trace
- 4820 Old Highway 138
- 4811 Jersey Walnut Grove Rd
- 4860 Jersey Walnut Grove Rd
- 4878 Jersey Walnut Grove Rd
- 4795 Jersey Walnut Grove Rd
- 4790 Jersey Walnut Grove Rd
- 4890 Jersey Walnut Grove Rd
- 4889 Jersey Walnut Grove Rd
- 4899 Jersey Walnut Grove Rd
- 4775 Jersey Walnut Grove Rd
- 4910 Jersey Walnut Grove Rd
- 4911 Jersey Walnut Grove Rd
- 4770 Jersey Walnut Grove Rd
- 195 Old Highway 81
- 4926 Jersey Walnut Grove Rd
- 213 Old Hwy 81 (2 54 Acres) Tract One
- 4899 Jersey Walnut Grove Rd
- 333 Hightower Ridge Rd
- 1415 Olympic Ct
- 4940 Jersey Walnut Grove Rd
- 77 Old Highway 81 SE