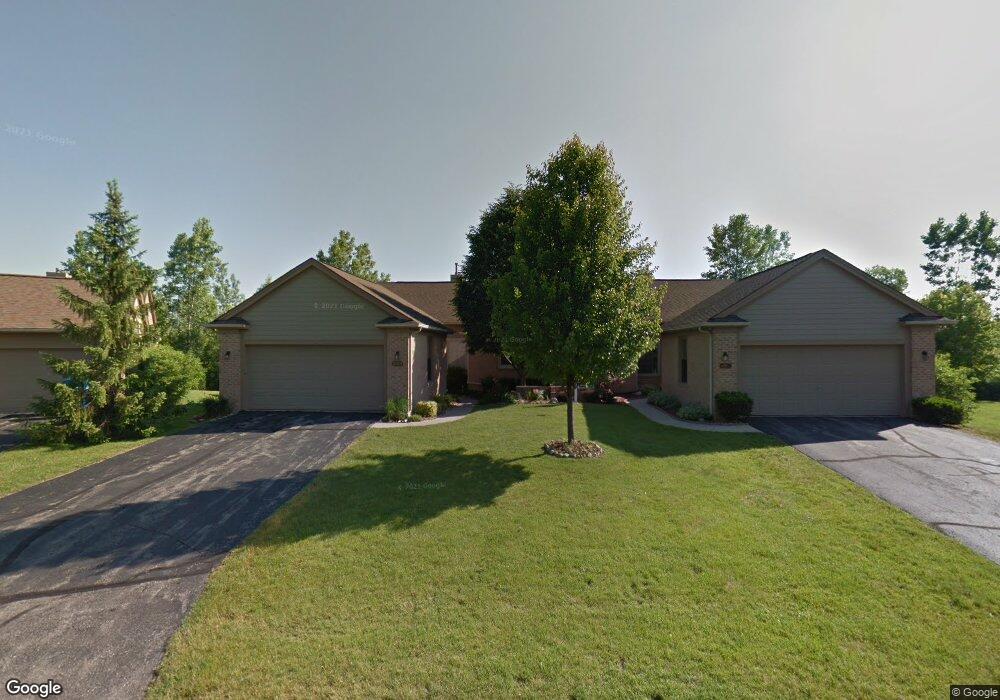
4859 Lone Oak Ct Unit 8 Ann Arbor, MI 48108
Stonebridge NeighborhoodEstimated Value: $533,000 - $580,000
3
Beds
3
Baths
1,448
Sq Ft
$379/Sq Ft
Est. Value
About This Home
This home is located at 4859 Lone Oak Ct Unit 8, Ann Arbor, MI 48108 and is currently estimated at $548,709, approximately $378 per square foot. 4859 Lone Oak Ct Unit 8 is a home located in Washtenaw County with nearby schools including Bryant Elementary School, Pattengill Elementary School, and Tappan Middle School.
Ownership History
Date
Name
Owned For
Owner Type
Purchase Details
Closed on
Sep 24, 2004
Sold by
Pearson Mary Kay and Pearson May Catherine
Bought by
Bruce Gerald E and Bruce Marlene P
Current Estimated Value
Home Financials for this Owner
Home Financials are based on the most recent Mortgage that was taken out on this home.
Original Mortgage
$325,000
Interest Rate
5.71%
Mortgage Type
Purchase Money Mortgage
Purchase Details
Closed on
May 2, 2003
Sold by
Pearson John Ervin
Bought by
Pearson Mary Catherine
Purchase Details
Closed on
Mar 28, 2002
Sold by
Knutsen Jay T
Bought by
Pearson Mary Kay
Purchase Details
Closed on
Jan 9, 2001
Sold by
Trus Matthews Judith Ann
Bought by
Knutsen Jay T
Purchase Details
Closed on
Sep 3, 1999
Sold by
Taylor Carol A Sanford
Bought by
Matthews Judith Ann
Create a Home Valuation Report for This Property
The Home Valuation Report is an in-depth analysis detailing your home's value as well as a comparison with similar homes in the area
Home Values in the Area
Average Home Value in this Area
Purchase History
| Date | Buyer | Sale Price | Title Company |
|---|---|---|---|
| Bruce Gerald E | $325,000 | Capital Title Ins | |
| Pearson Mary Catherine | -- | -- | |
| Pearson Mary Kay | $300,000 | -- | |
| Knutsen Jay T | $285,000 | -- | |
| Matthews Judith Ann | $289,000 | -- |
Source: Public Records
Mortgage History
| Date | Status | Borrower | Loan Amount |
|---|---|---|---|
| Previous Owner | Bruce Gerald E | $325,000 |
Source: Public Records
Tax History Compared to Growth
Tax History
| Year | Tax Paid | Tax Assessment Tax Assessment Total Assessment is a certain percentage of the fair market value that is determined by local assessors to be the total taxable value of land and additions on the property. | Land | Improvement |
|---|---|---|---|---|
| 2025 | $6,275 | $260,613 | $0 | $0 |
| 2024 | $4,197 | $219,294 | $0 | $0 |
| 2023 | $4,033 | $210,000 | $0 | $0 |
| 2022 | $6,058 | $212,700 | $0 | $0 |
| 2021 | $5,911 | $201,200 | $0 | $0 |
| 2020 | $5,798 | $190,300 | $0 | $0 |
| 2019 | $5,457 | $175,200 | $175,200 | $0 |
| 2018 | $5,374 | $174,000 | $0 | $0 |
| 2017 | $5,203 | $172,200 | $0 | $0 |
| 2016 | $3,352 | $131,799 | $0 | $0 |
| 2015 | -- | $131,405 | $0 | $0 |
| 2014 | -- | $127,300 | $0 | $0 |
| 2013 | -- | $127,300 | $0 | $0 |
Source: Public Records
Map
Nearby Homes
- 5117 Doral Ct Unit 2
- 1487 Saint James Blvd
- 5179 Wimbledon Cir
- 4955 Quincy Ct Unit 9
- 4107 Boulder Pond Dr Unit 33
- 5401 Pinnacle Ct Unit 32
- 2477 Winged Foot Ct Unit 10
- 2641 Aspen Rd
- 2313 Quaker Ridge Dr Unit 56
- 1670 W Ellsworth Rd
- 2724 Aspen Ct Unit 13
- 3956 Bridle Pass Unit 28
- 2736 Aspen Ct Unit 9
- 5656 Pebble Ridge Ct
- 2125 Evergreen Ln Unit 30
- 2157 Evergreen Dr Unit 23
- 3928 Steamboat Ct
- 3026 Cross Creek Ct Unit 69
- 5449 Countryside Dr
- 1631 Weatherstone Dr
- 4861 Lone Oak Ct
- 4857 Lone Oak Ct
- 4855 Lone Oak Ct
- 4865 Lone Oak Ct Unit 6
- 4853 Lone Oak Ct
- 4851 Lone Oak Ct Unit 12
- 4873 Lone Oak Ct Unit 4
- 4879 Lone Oak Ct
- 4858 Lone Oak Ct
- 4854 Lone Oak Ct
- 4881 Lone Oak Ct Unit 2
- 4864 Lone Oak Ct
- 4860 Lone Oak Ct
- 4850 Lone Oak Ct Unit 13
- 4870 Lone Oak Ct
- 0 Lone Oak Ct
- 4885 Lone Oak Ct Unit 1
- 4872 Lone Oak Ct Unit 19
- 4878 Lone Oak Ct
- 4882 Lone Oak Ct